Fig. 4
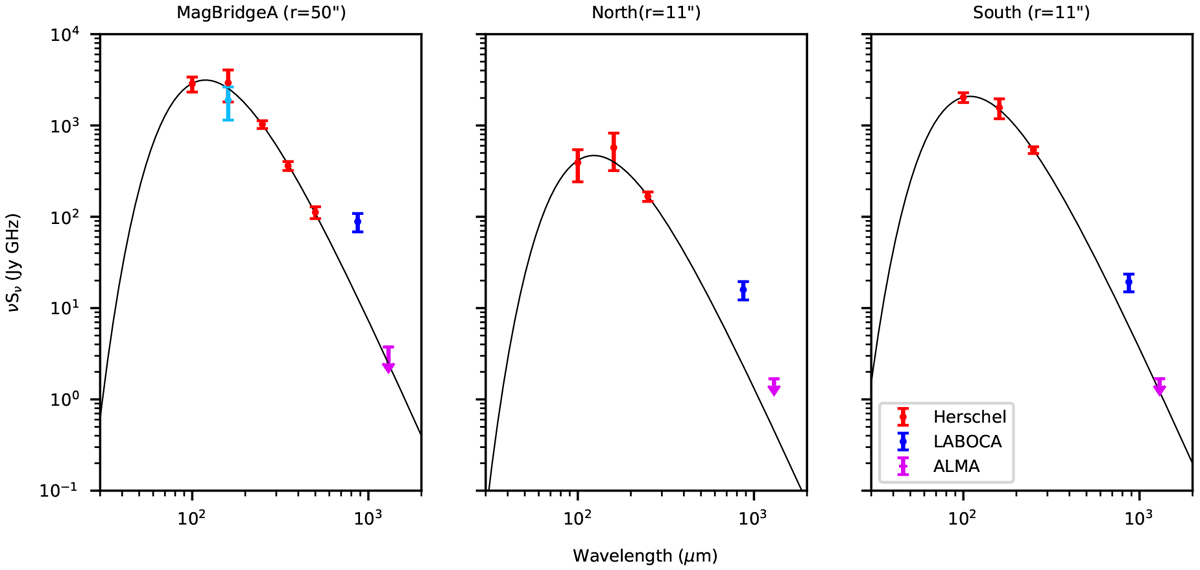
SEDs for Magellanic Bridge A and the North and South sources. The points correspond to the energy νSν derived fromthe measured flux density Sλ, obtained using aperture photometry. Red points correspond to νSν obtained using Herschel data. Dark blue points correspond to the energy νSν obtained using the LABOCA image. The purple arrow corresponds to the νSν upper limit at 1.3 mm using the ALMA continuum image. Left panel: Magellanic Bridge A SED, for which were used the 100, 160, 250, 350, and 500 μm Herschel continuum images; the 160 μm Spitzer continuum image; and the 870 μm (LABOCA) and 1.3 mm (ALMA) continuum images, all with a common resolution of 43′′. The flux from Magellanic Bridge A was measured inside a circular aperture of radius r = 50′′. The North and South sources SEDs are shown in the last two panels, constructed with the Hershel 100, 160, and 250 μm continuum images, the 870 μm (LABOCA) and 1.3 mm (ALMA) continuum images at a common resolution of 22′′. The fluxes from sources North and South were measured in a circular aperture of radius r = 11′′. The MBB model that best fits the Herschel points for each source is shown as a black curve. The parameters of each curve are listed in Table 4.
Current usage metrics show cumulative count of Article Views (full-text article views including HTML views, PDF and ePub downloads, according to the available data) and Abstracts Views on Vision4Press platform.
Data correspond to usage on the plateform after 2015. The current usage metrics is available 48-96 hours after online publication and is updated daily on week days.
Initial download of the metrics may take a while.