Fig. 2
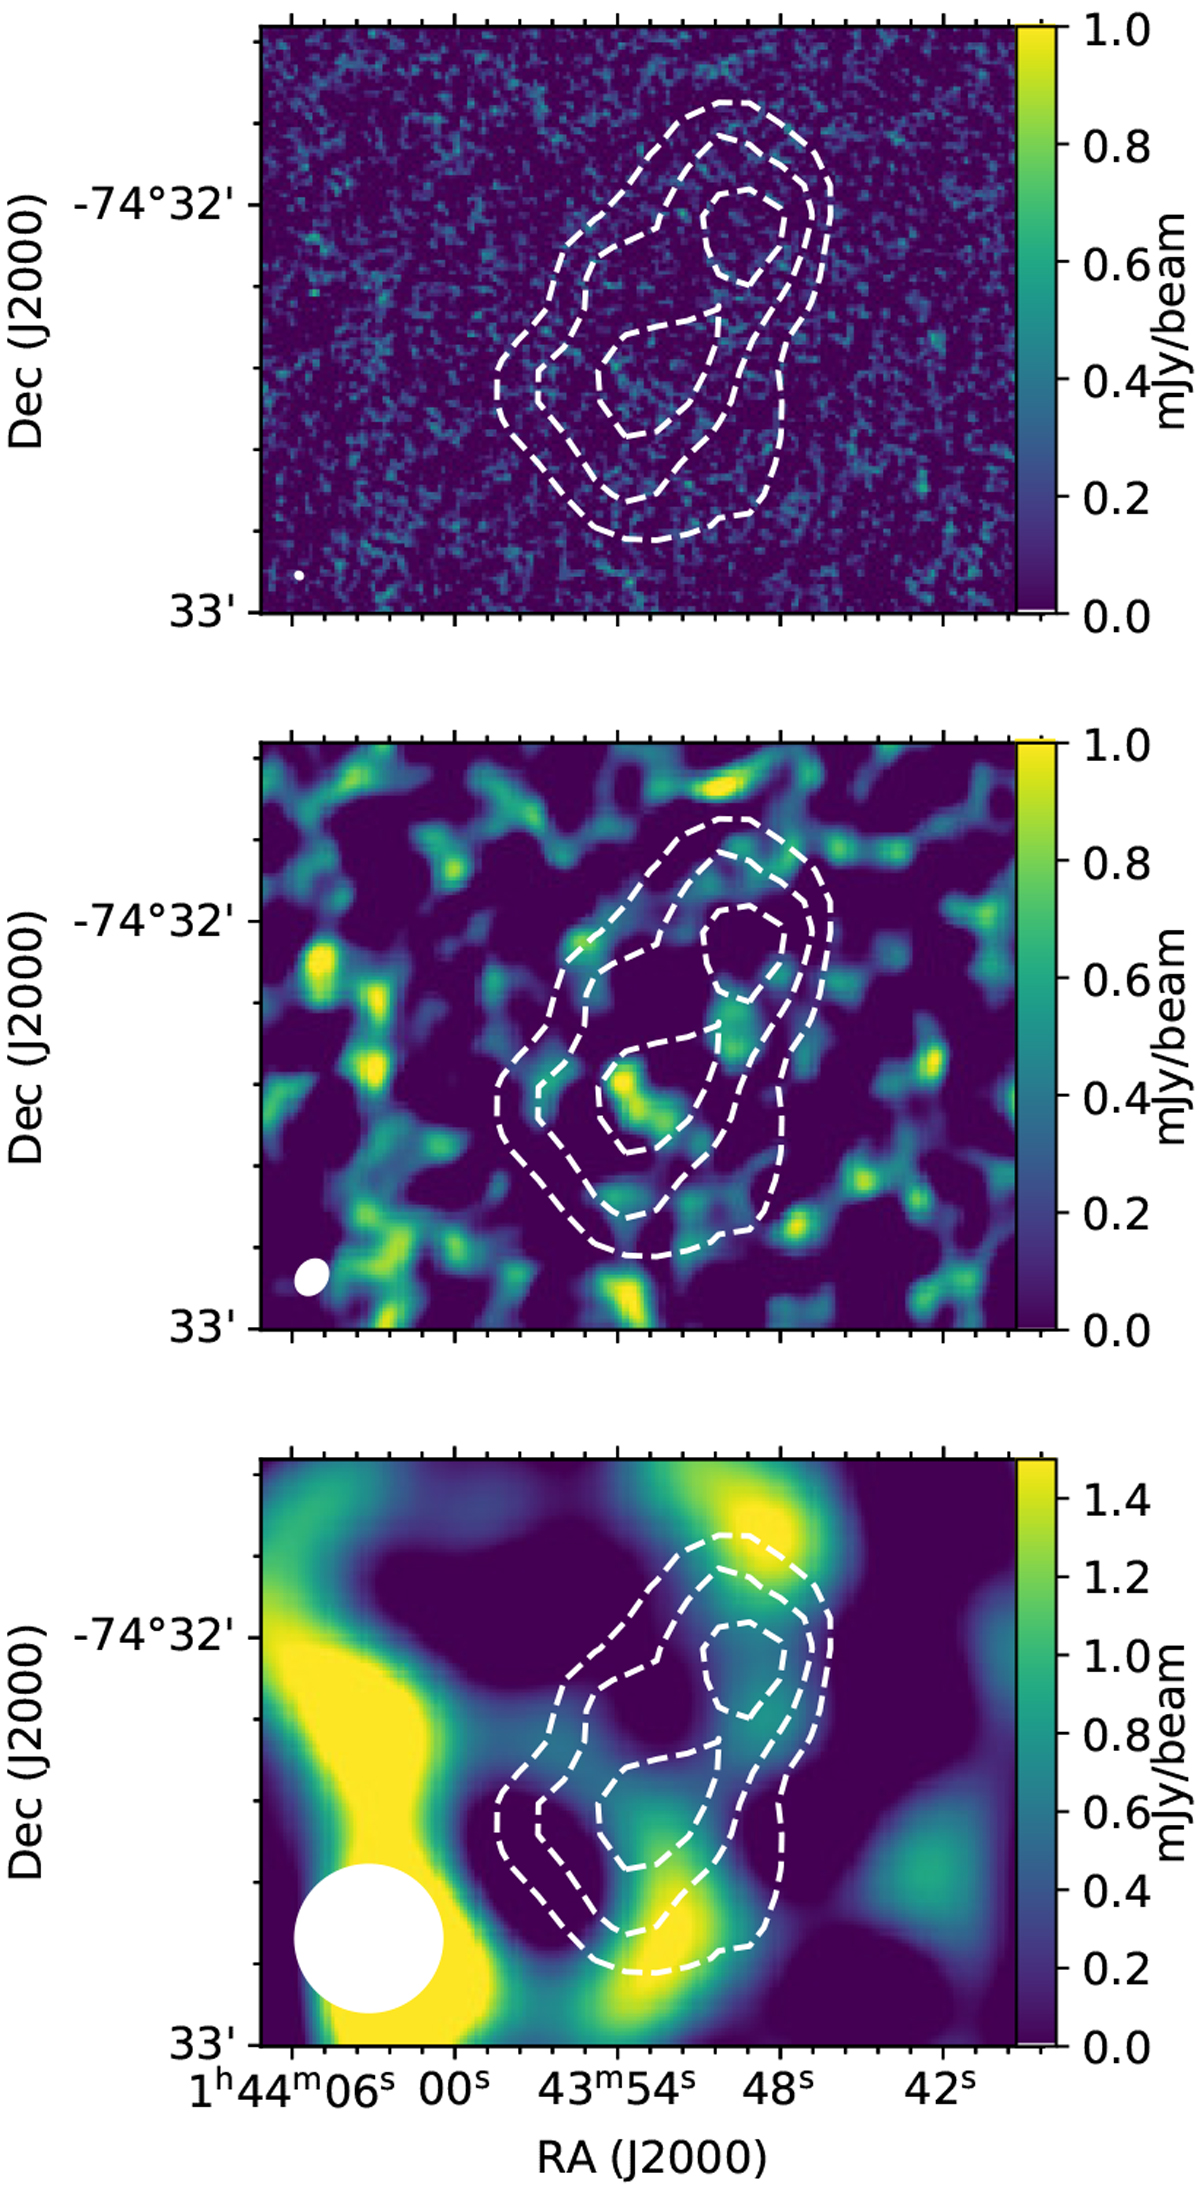
ALMA continuum images at 1.3 mm of Magellanic Bridge A, generated using 12m and 7m data, where imaging is performed using natural weight. Top image: continuum without tapering in the visibility data. Middle image: continuum with its visibility data tapered using a Gaussian with an on-sky FWHM of 5′′. Bottom image: tapered continuum image convolved to reach a resolution of 22′′. The color scale for this last image is different from the other two images. The white ellipse in the bottom left corner of each image represents the beam size. Dashed contours correspond to continuum emission in the APEX 870 μm map at 25, 30, and 35 mJy beam−1.
Current usage metrics show cumulative count of Article Views (full-text article views including HTML views, PDF and ePub downloads, according to the available data) and Abstracts Views on Vision4Press platform.
Data correspond to usage on the plateform after 2015. The current usage metrics is available 48-96 hours after online publication and is updated daily on week days.
Initial download of the metrics may take a while.