Fig. 1
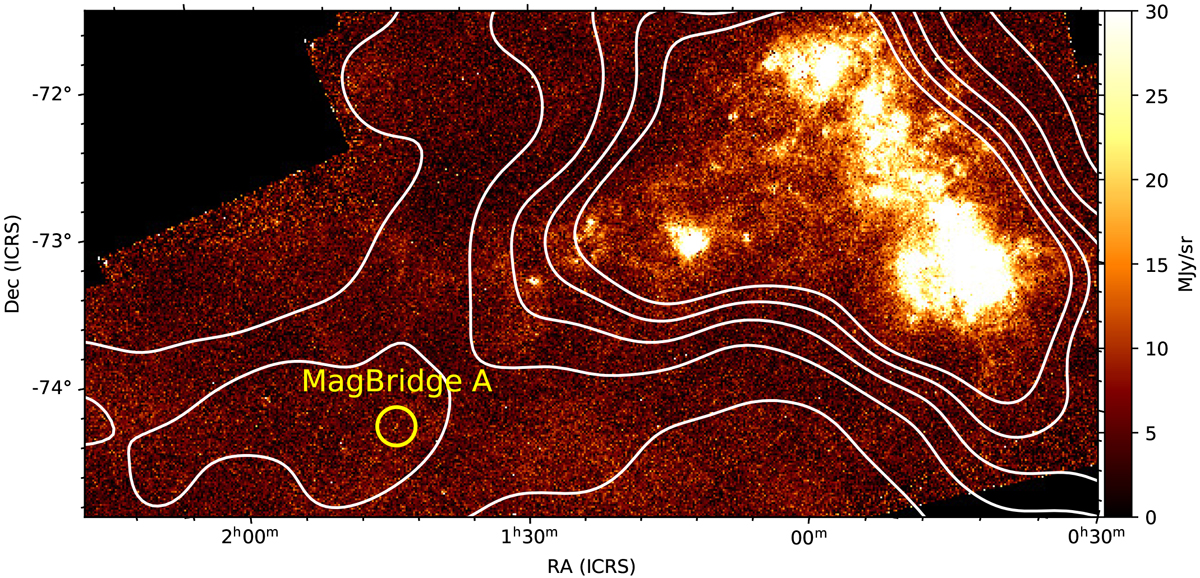
Herschel 160 μm map of the SMC from Meixner et al. (2013). White contours represent the H I column density map constructed using the Parkes Galactic All-Sky Survey (GASS) first data release (McClure-Griffiths et al. 2009). The contour levels are (1, 1.5, 2, 2.5, and 3) × 1021 cm−2. The yellow circular region gives the position of Magellanic Bridge A (labeled MagBridge A).
Current usage metrics show cumulative count of Article Views (full-text article views including HTML views, PDF and ePub downloads, according to the available data) and Abstracts Views on Vision4Press platform.
Data correspond to usage on the plateform after 2015. The current usage metrics is available 48-96 hours after online publication and is updated daily on week days.
Initial download of the metrics may take a while.