Free Access
Fig. 7.
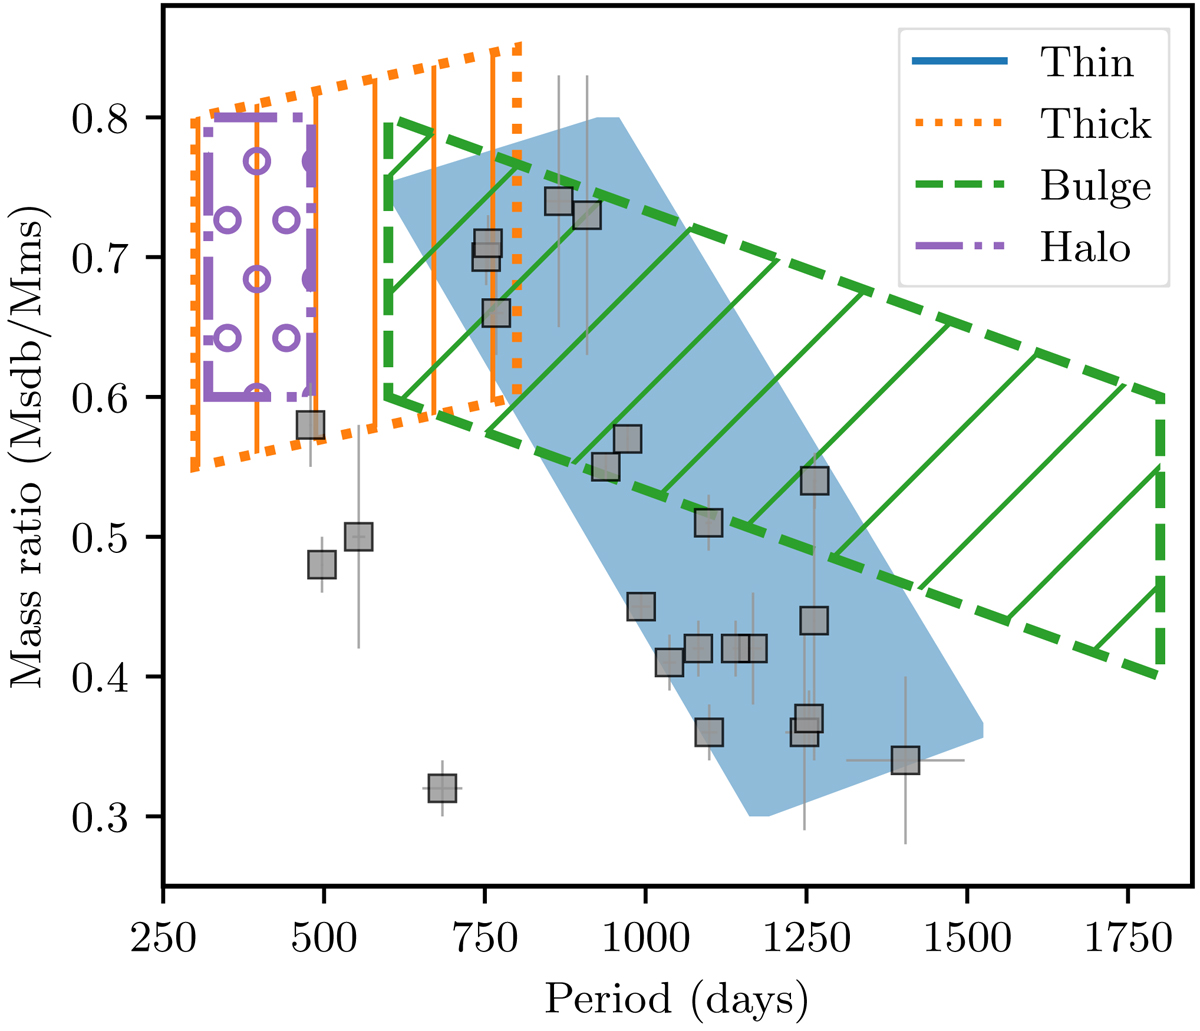
Schematic plot showing where wide sdBs formed from the different Galactic sub-populations are located in the period – mass ratio diagram. Thin-disc objects are shown in blue, thick-disc objects are shown in orange, bulge objects are shown in green and halo objects in purple. The observed systems are plotted in grey squares.
Current usage metrics show cumulative count of Article Views (full-text article views including HTML views, PDF and ePub downloads, according to the available data) and Abstracts Views on Vision4Press platform.
Data correspond to usage on the plateform after 2015. The current usage metrics is available 48-96 hours after online publication and is updated daily on week days.
Initial download of the metrics may take a while.