Fig. 4.
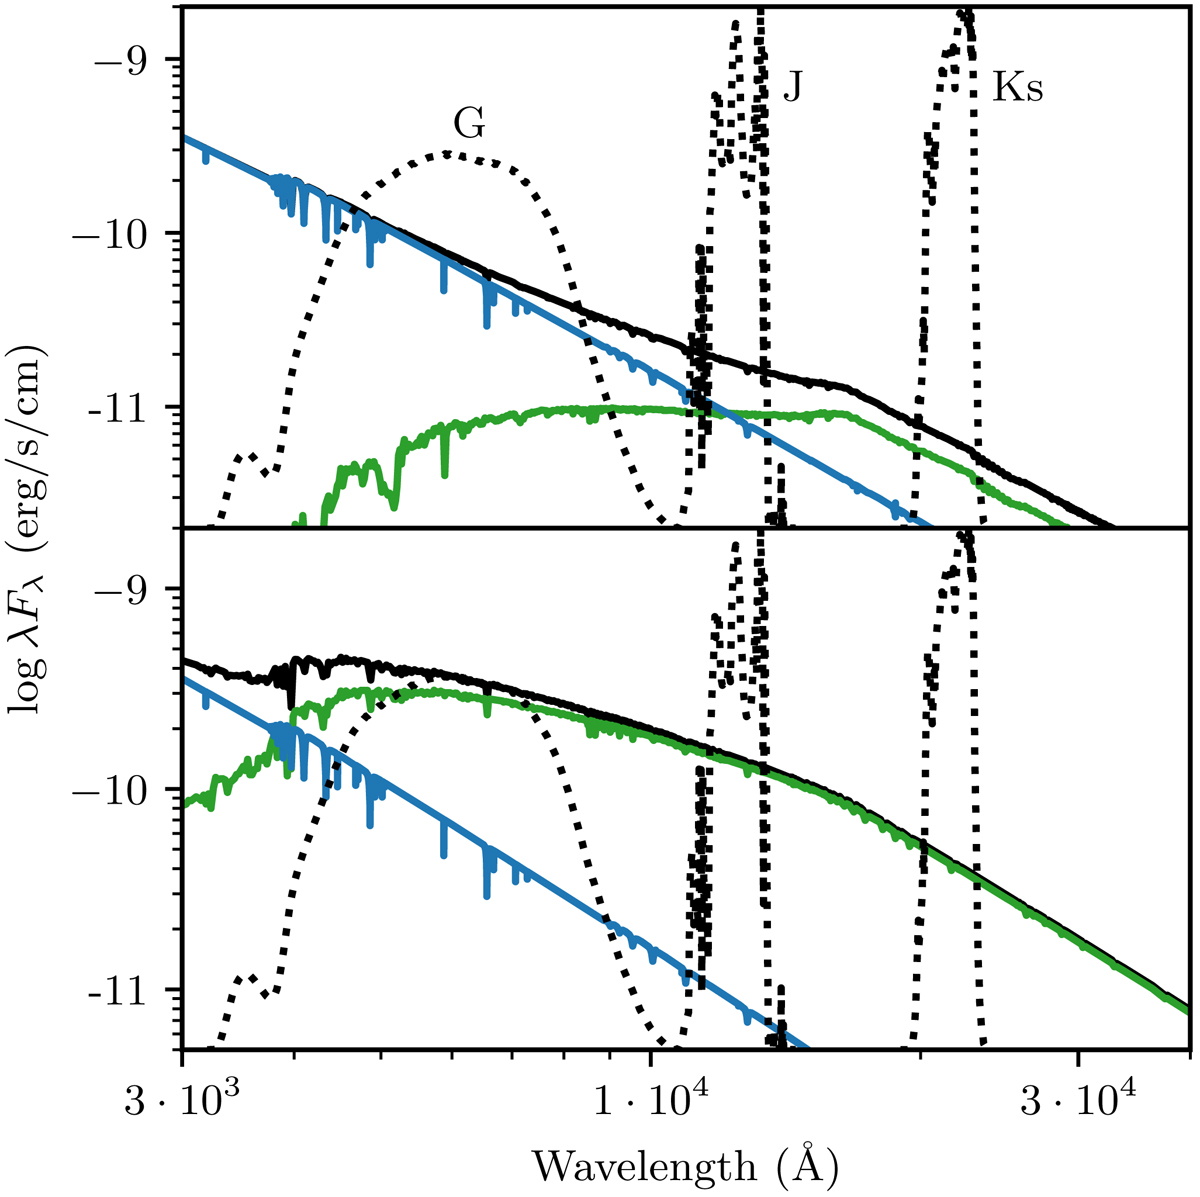
Spectral energy distribution for an sdB+MS binary with 90% light contribution of the sdB in the Gaia-G band in the top panel, and with 20% contribution in the bottom panel. The binary SED is plotted in black while the contributions of the sdB and MS component are shown respectively in blue and green. In black-dotted line, the transmission curves for the Gaia-G, 2MASS-J and 2MASS-Ks filter are shown from left to right.
Current usage metrics show cumulative count of Article Views (full-text article views including HTML views, PDF and ePub downloads, according to the available data) and Abstracts Views on Vision4Press platform.
Data correspond to usage on the plateform after 2015. The current usage metrics is available 48-96 hours after online publication and is updated daily on week days.
Initial download of the metrics may take a while.