Fig. 2.
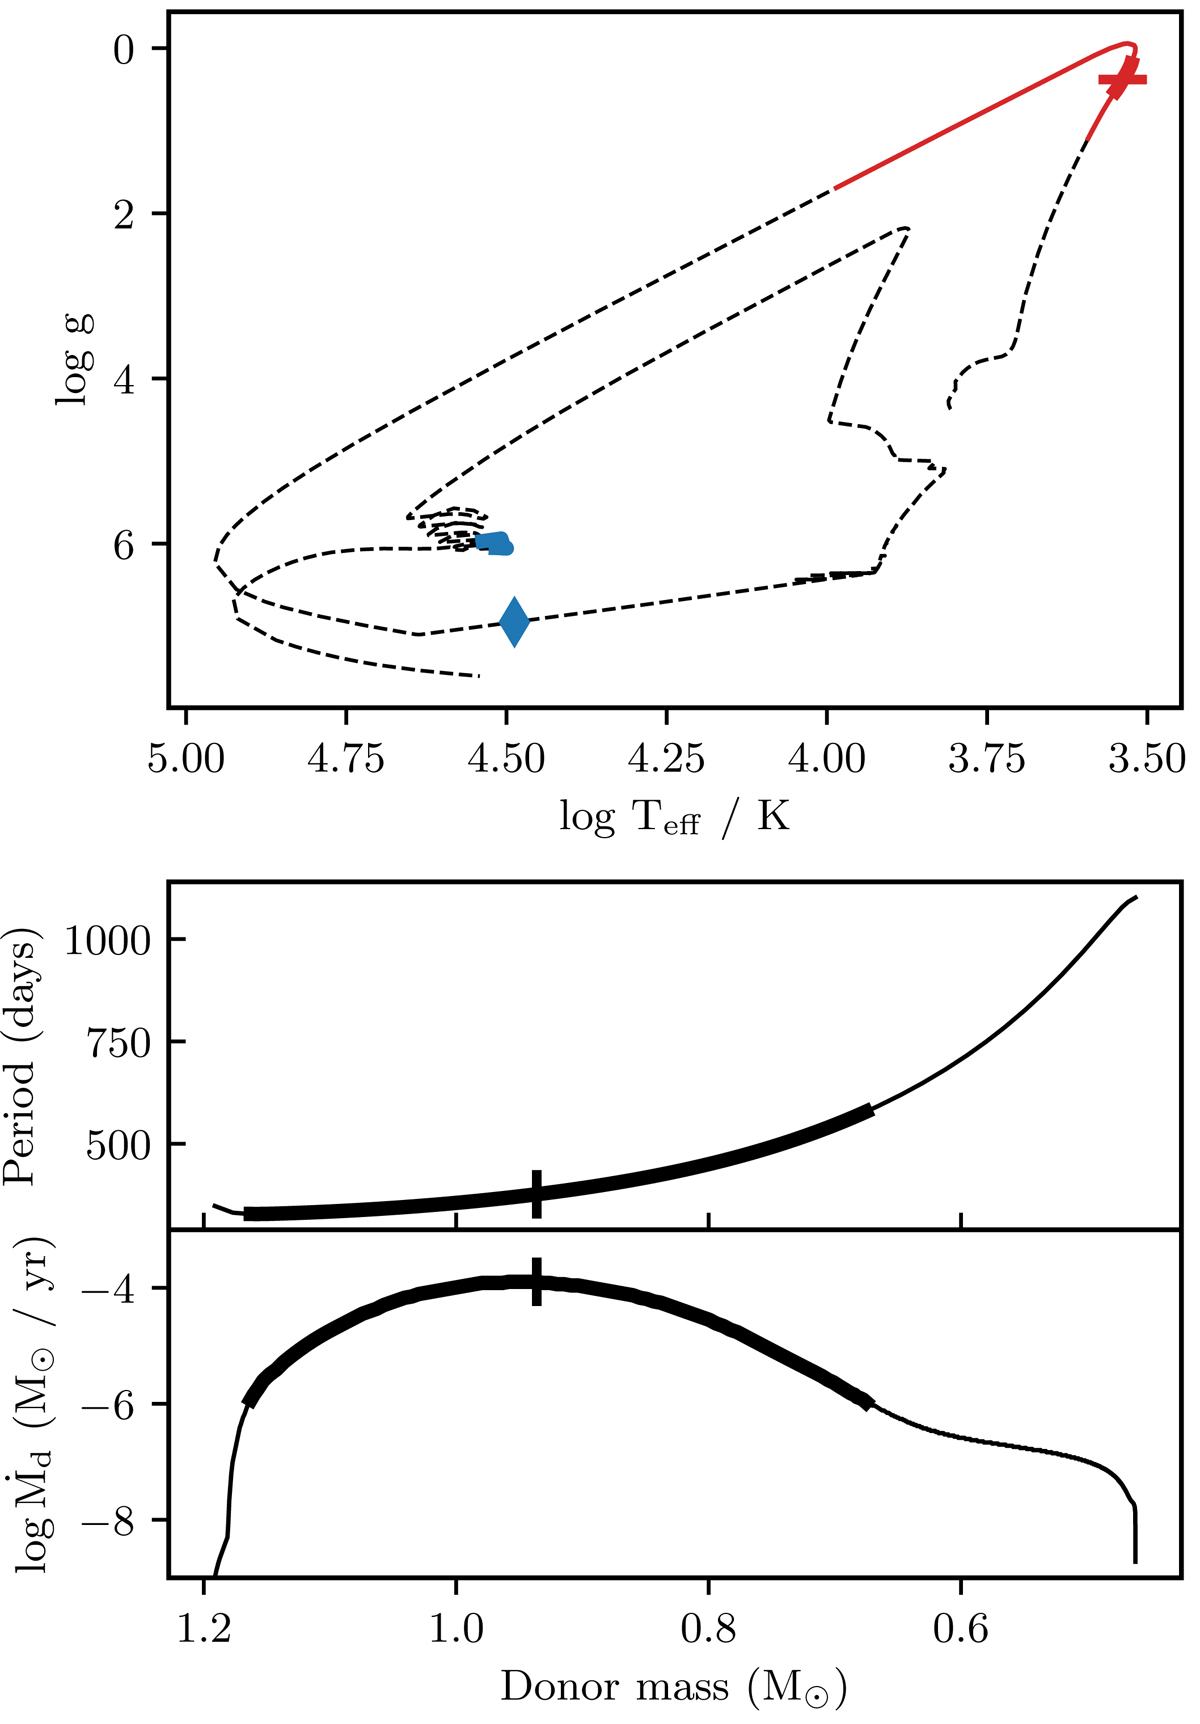
Example MESA track for a binary with a 1.2 M⊙ donor star, a 0.85 M⊙ companion, an initial period Pi = 350 days and a metallicity [Fe/H] = −0.15, which produces a hot composite sdB binary. Top panel: track for the donor star in the HR diagram. The mass loss phase is marked in red; the thin red line shows the phase when Ṁ > 10−9 M⊙ yr−1, thick red line corresponds to Ṁ > 10−6 M⊙ yr−1 and the moment of maximum mass loss is marked with a horizontal red marker. The first He flash is marked with a blue diamond and the core He burning phase is shown in a thick blue line. The phase between the He flash and the core He burning is very short compared to the core He burning phase. Bottom panel: orbital period and mass loss rate during the mass loss phase. The same markings are used as in the HR diagram: the thin black line shows the phase with Ṁ > 10−9 M⊙ yr−1, thick black line corresponds to Ṁ > 10−6 M⊙ yr−1 and maximum mass loss is marked with a vertical black marker.
Current usage metrics show cumulative count of Article Views (full-text article views including HTML views, PDF and ePub downloads, according to the available data) and Abstracts Views on Vision4Press platform.
Data correspond to usage on the plateform after 2015. The current usage metrics is available 48-96 hours after online publication and is updated daily on week days.
Initial download of the metrics may take a while.