Fig. 15.
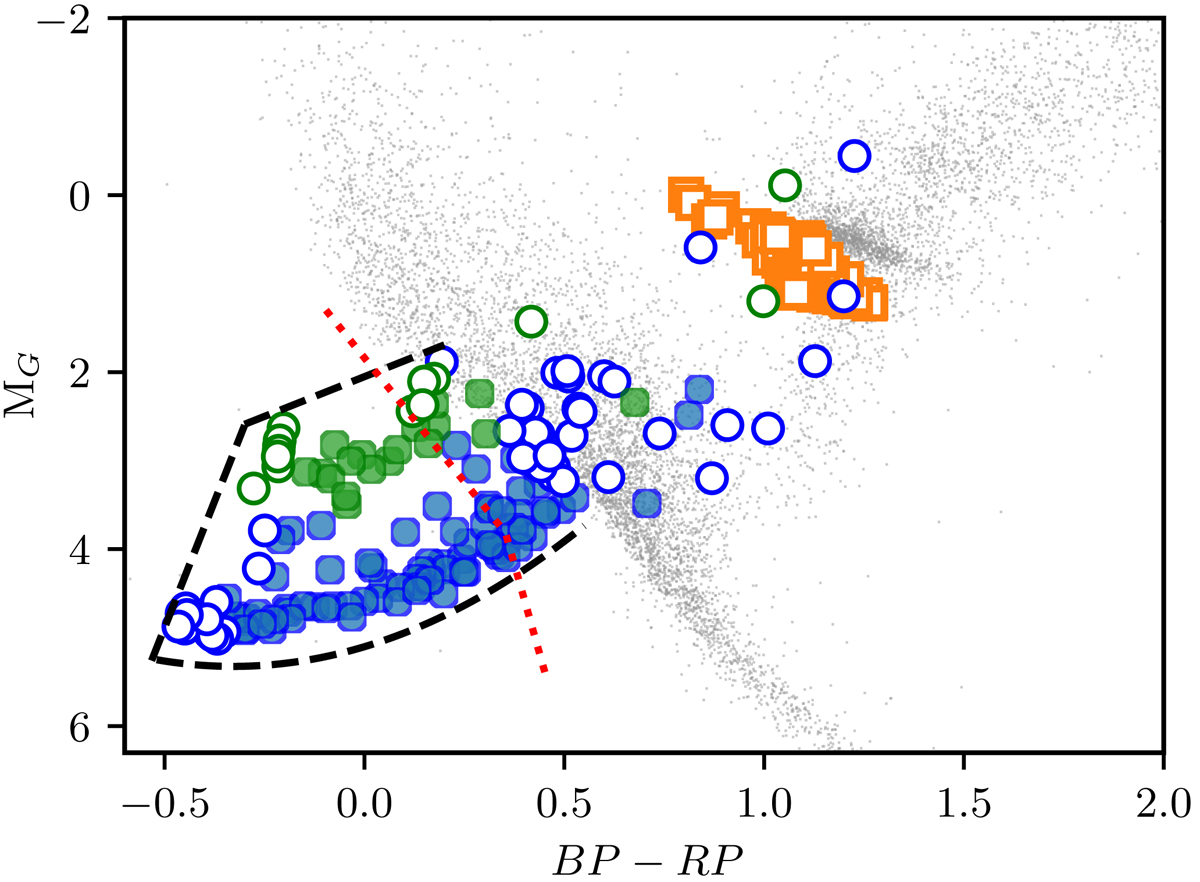
Gaia colour-magnitude diagram. Full blue circles show composite-spectrum sdB+MS binaries and empty blue circles show the single-lined sdB+MS binaries. sdA+MS binaries are similarly coded in green circles. The systems that will form an sdB+MS or sdA+MS binary are shown with orange squares at the moment when the interaction phase starts. As a comparison, the Gaia colour-magnitude diagram of the HIPPARCOS sample is shown in grey.
Current usage metrics show cumulative count of Article Views (full-text article views including HTML views, PDF and ePub downloads, according to the available data) and Abstracts Views on Vision4Press platform.
Data correspond to usage on the plateform after 2015. The current usage metrics is available 48-96 hours after online publication and is updated daily on week days.
Initial download of the metrics may take a while.