Fig. 1.
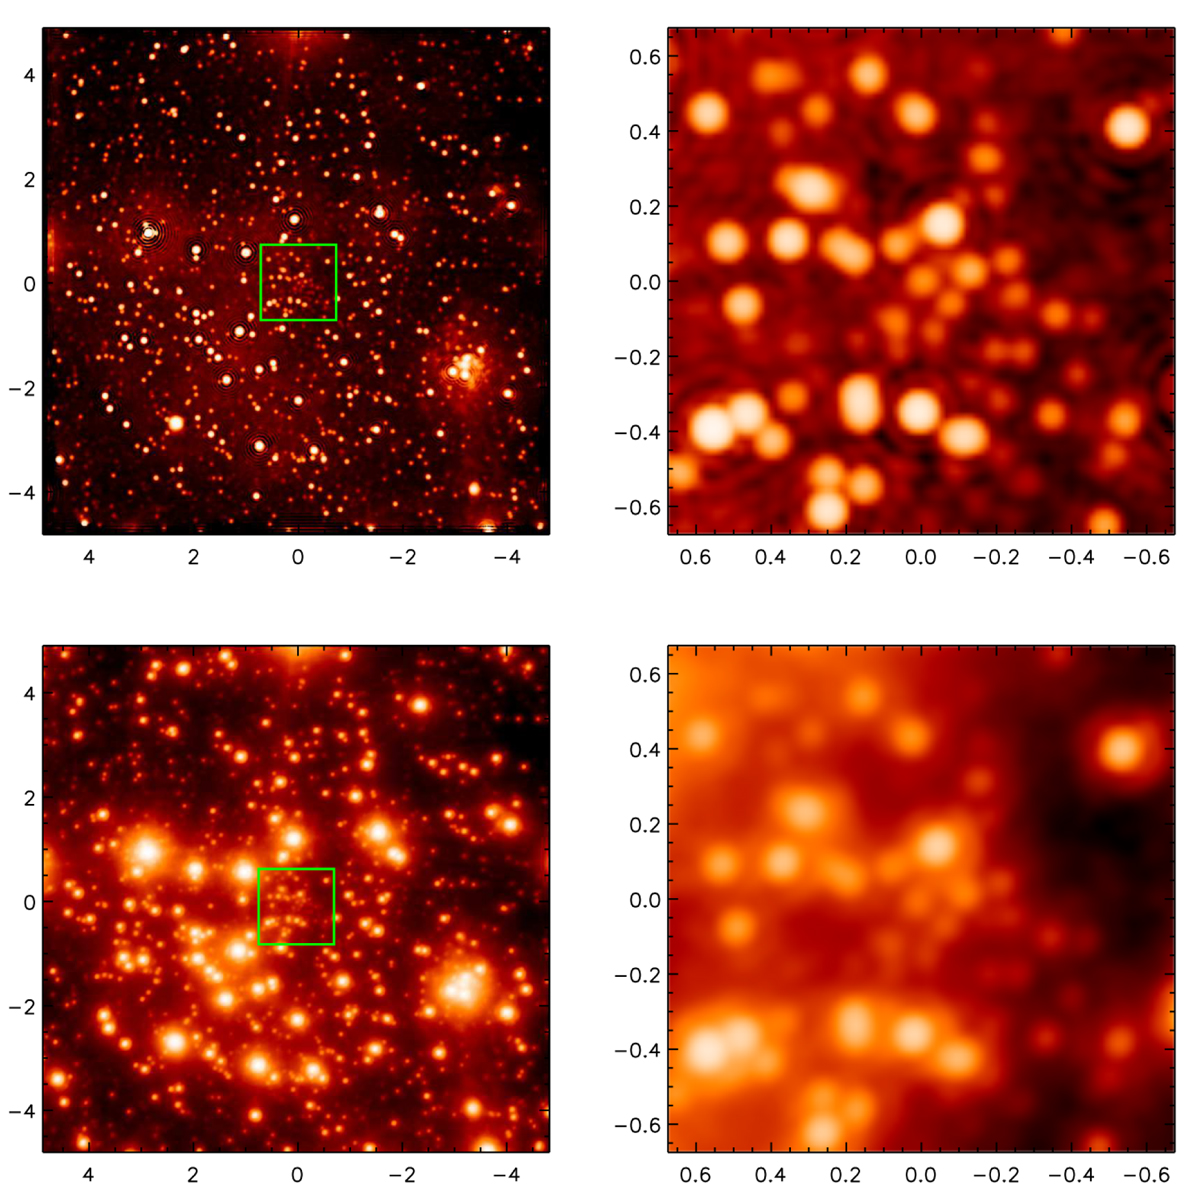
Upper left: deep image after combining all 2012 Ks exposures with the holography technique. Lower left: deep image after combining all 2012 Ks exposures with the SSA technique. The insets on the right hand side show magnifications of the areas marked by the green squares. Colour scales are logarithmic. The axes mark offsets from Sgr A* along Right Ascension and Declination in arcseconds.
Current usage metrics show cumulative count of Article Views (full-text article views including HTML views, PDF and ePub downloads, according to the available data) and Abstracts Views on Vision4Press platform.
Data correspond to usage on the plateform after 2015. The current usage metrics is available 48-96 hours after online publication and is updated daily on week days.
Initial download of the metrics may take a while.