Fig. 7.
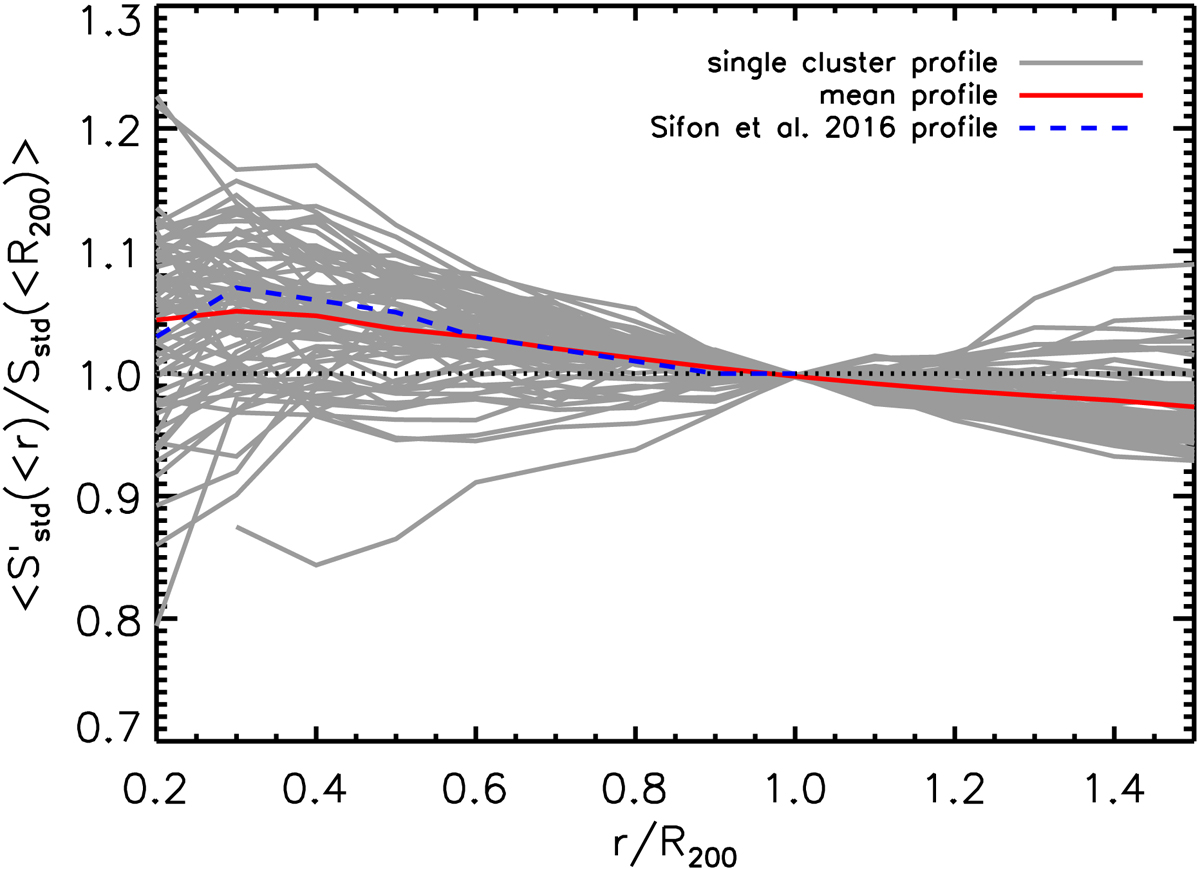
Average velocity dispersion profile within a given enclosed radius r, ⟨S′std(< r)/Sstd(< R200)⟩, normalised to R200. The red line represents the mean at each radius of the individual 73 simulated GC profiles (grey lines). The numerical values are given in Table 4. The dashed blue line represents the Sifón et al. (2016) profile, which is almost coincident with our derived profile.
Current usage metrics show cumulative count of Article Views (full-text article views including HTML views, PDF and ePub downloads, according to the available data) and Abstracts Views on Vision4Press platform.
Data correspond to usage on the plateform after 2015. The current usage metrics is available 48-96 hours after online publication and is updated daily on week days.
Initial download of the metrics may take a while.