Fig. 6.
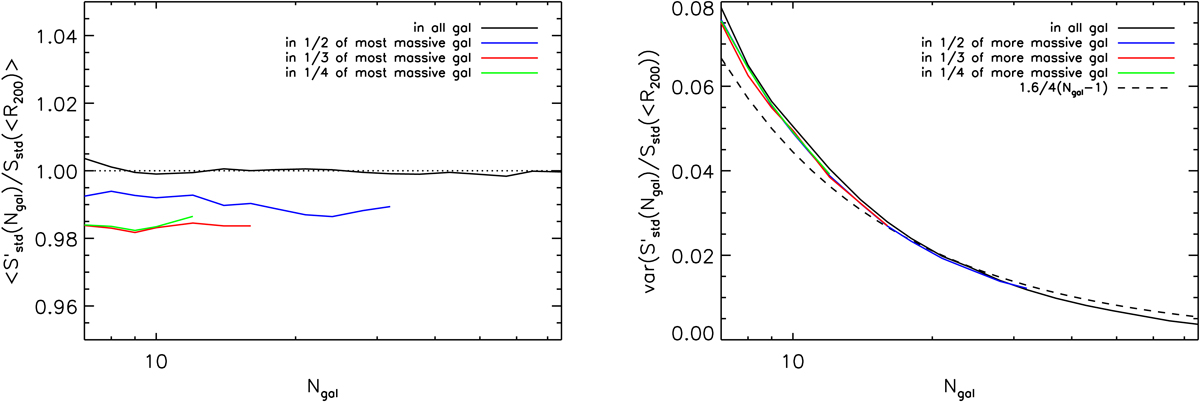
Left panel: mean (bias) of S′std(Ngal)/Sstd(< R200) as a function of the number of galaxies Ngal, calculated by choosing galaxies within 100% (solid black line), 1/2 (solid blue line), 1/3 (solid red line), and 1/4 (solid green line) of the complete cluster member samples. Right panel: variance of S′std(Ngal)/Sstd(< R200) as a function of the number of galaxies Ngal. The dashed line represents the theoretical expectation for the variance of the dispersion according to Eq. (10).
Current usage metrics show cumulative count of Article Views (full-text article views including HTML views, PDF and ePub downloads, according to the available data) and Abstracts Views on Vision4Press platform.
Data correspond to usage on the plateform after 2015. The current usage metrics is available 48-96 hours after online publication and is updated daily on week days.
Initial download of the metrics may take a while.