Free Access
Fig. B.1.
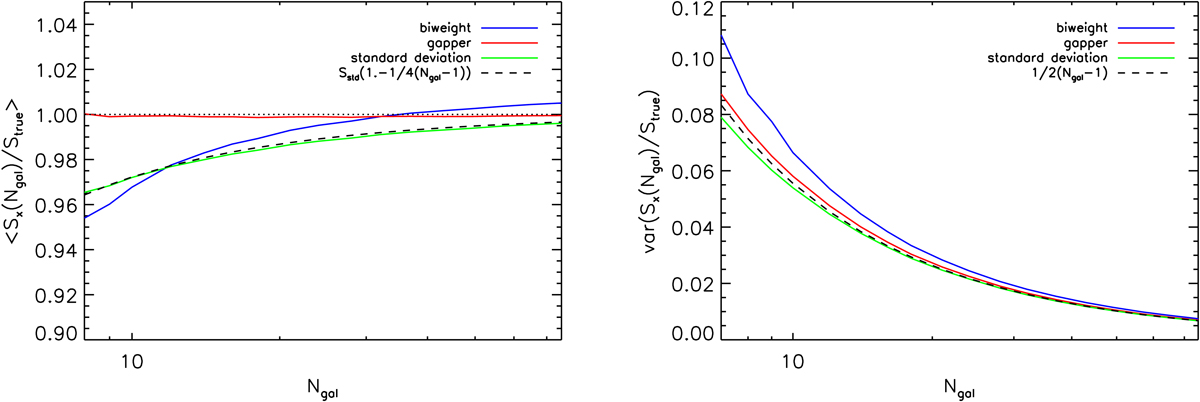
Mean (left panel) and variance (right panel) of SX(Ngal) as a function of the number of galaxies Ngal for the case of Gaussian-distributed random velocities. Green, red, and blue lines represent the behaviour of the standard deviation, gapper, and biweight estimators, respectively.
Current usage metrics show cumulative count of Article Views (full-text article views including HTML views, PDF and ePub downloads, according to the available data) and Abstracts Views on Vision4Press platform.
Data correspond to usage on the plateform after 2015. The current usage metrics is available 48-96 hours after online publication and is updated daily on week days.
Initial download of the metrics may take a while.