Fig. 11.
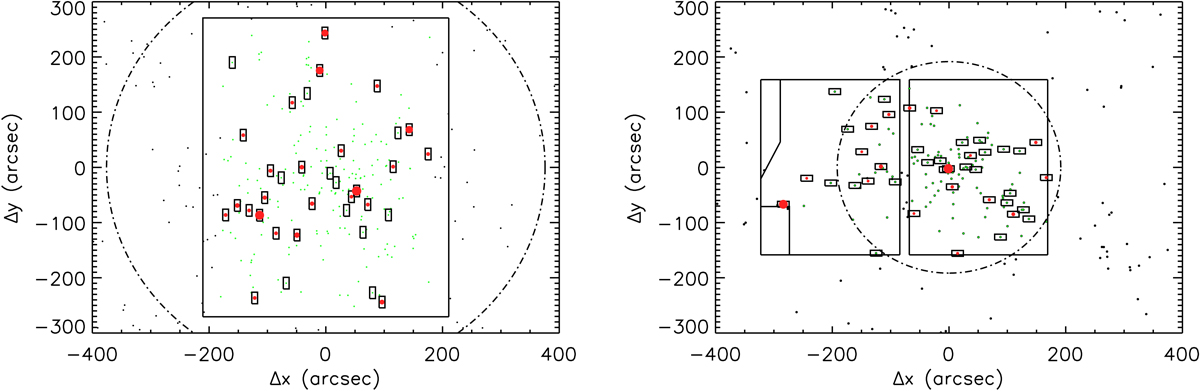
Left panel: example of DOLORES/TNG simulated mask. Right panel: example of OSIRIS/GTC simulated mask. See text for details. Black and green dots represent cluster members outside or inside the telescope field of view, respectively. Black rectangles are the slitlets, and the red points the line-of-sight velocity measurements (the symbol size is proportional to the mass of each galaxy with respect to the most massive galaxy in the mask). The circle in the dotted line represents the projected R200 radius.
Current usage metrics show cumulative count of Article Views (full-text article views including HTML views, PDF and ePub downloads, according to the available data) and Abstracts Views on Vision4Press platform.
Data correspond to usage on the plateform after 2015. The current usage metrics is available 48-96 hours after online publication and is updated daily on week days.
Initial download of the metrics may take a while.