Fig. 1.
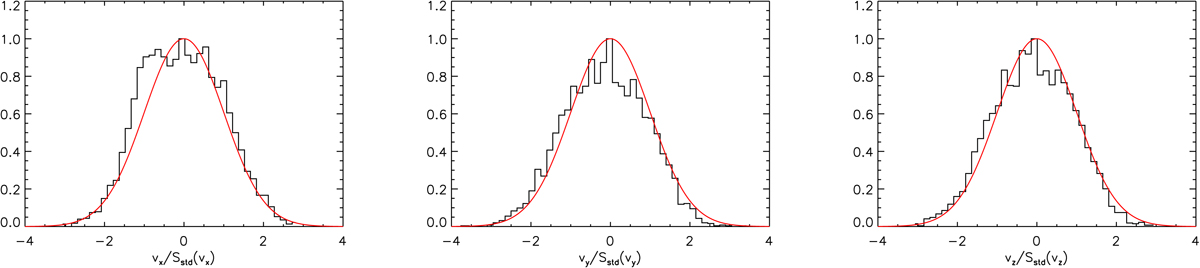
Histograms showing the distribution of individual line-of-sight velocities of all cluster members contained in a cylinder of projected radius R200 along each selected axis for all the 73 simulated clusters, and for three possible orientations of the simulation box along the line of sight (x-, y-, and z-axes). The red line corresponds to a Gaussian profile with the same mean and variance as the full sample.
Current usage metrics show cumulative count of Article Views (full-text article views including HTML views, PDF and ePub downloads, according to the available data) and Abstracts Views on Vision4Press platform.
Data correspond to usage on the plateform after 2015. The current usage metrics is available 48-96 hours after online publication and is updated daily on week days.
Initial download of the metrics may take a while.