Fig. 14.
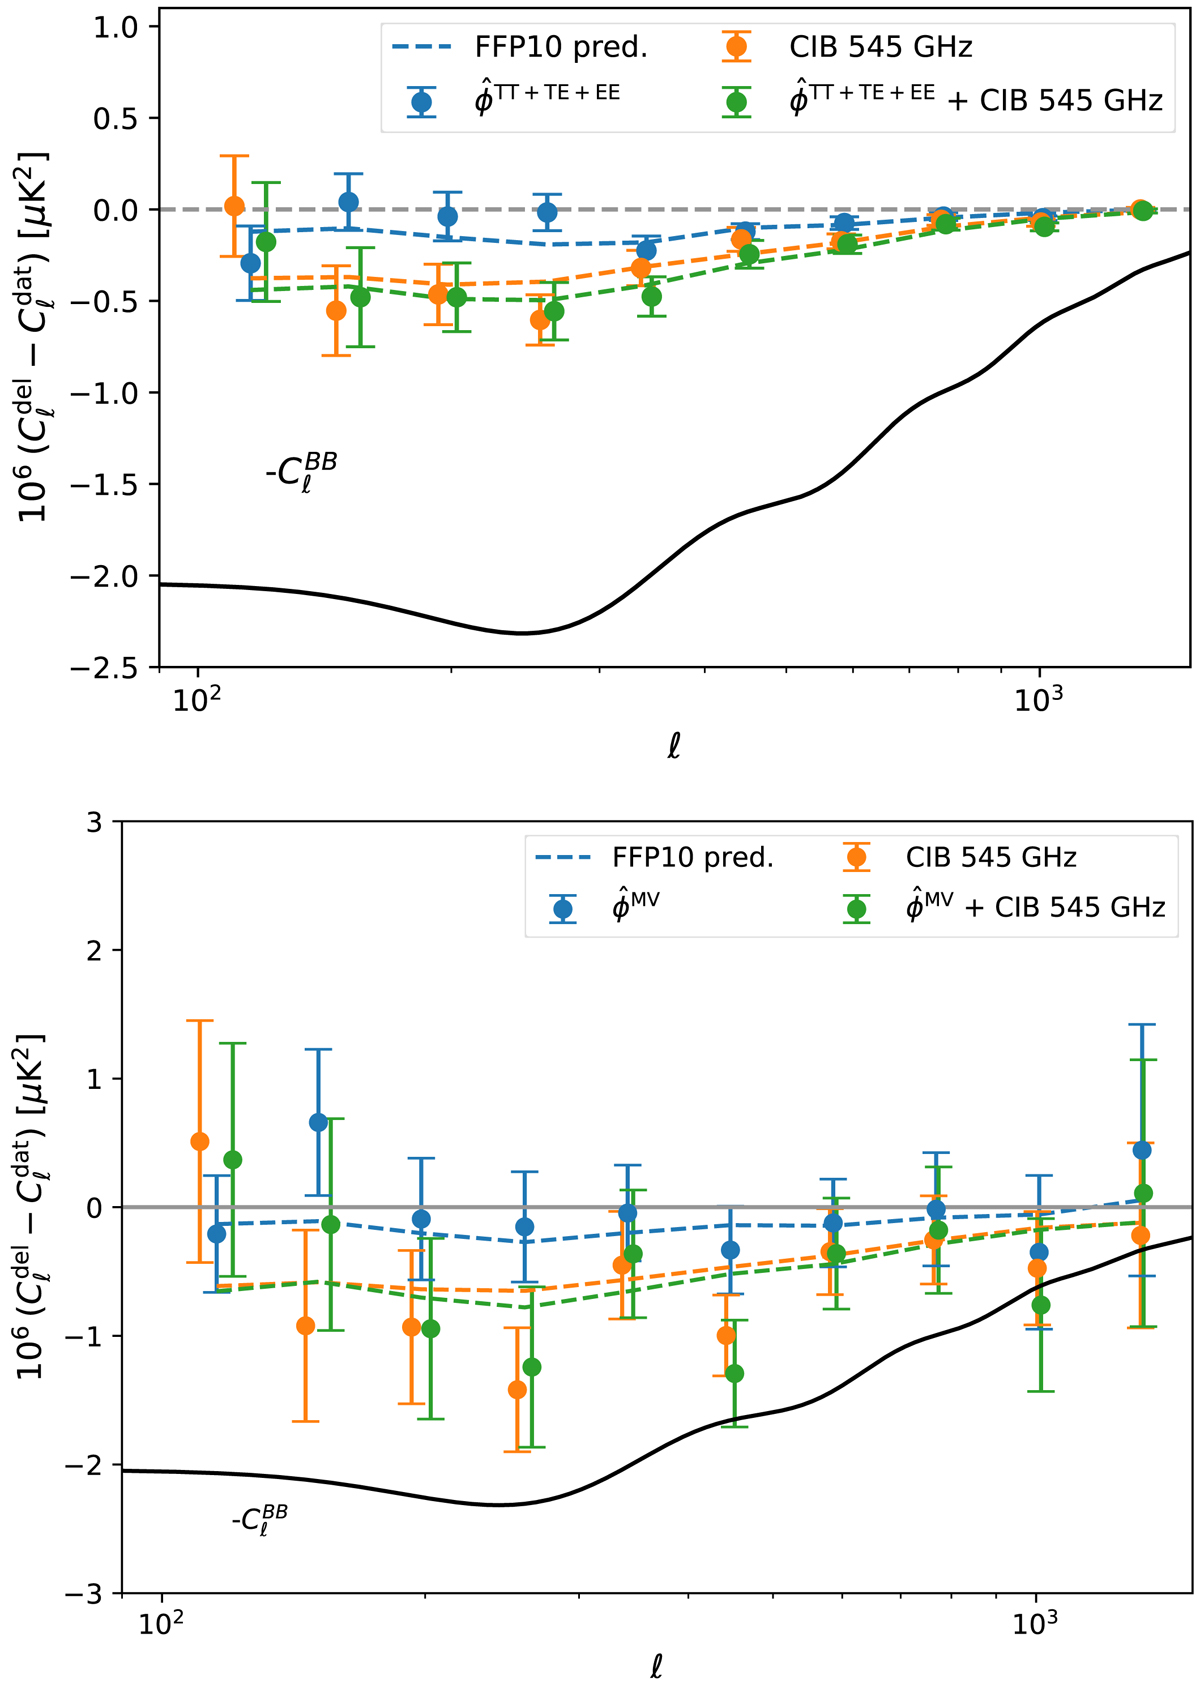
Difference between the delensed and original B-mode power spectrum for the SMICA CMB polarization maps. In the upper panel, the delensed B-mode map is obtained by template subtraction. The templates are constructed using the labelled lensing tracers, and the Wiener-filtered E-mode map, as discussed in Sect. 3.4.1. The dashed lines show predictions obtained by repeating these operations on the FFP10 set of Planck simulations. The black curve, ![]() for our fiducial model, shows the difference expected for perfect delensing. Summary statistics are presented in Table 3. In the lower panel, a remapping method is used, and the delensing signature is obtained after subtraction of biases, as described in Sect. 3.4.2, with summary statistics in Table 4. In this case, the actual total B-mode power is not decreased after delensing.
for our fiducial model, shows the difference expected for perfect delensing. Summary statistics are presented in Table 3. In the lower panel, a remapping method is used, and the delensing signature is obtained after subtraction of biases, as described in Sect. 3.4.2, with summary statistics in Table 4. In this case, the actual total B-mode power is not decreased after delensing.
Current usage metrics show cumulative count of Article Views (full-text article views including HTML views, PDF and ePub downloads, according to the available data) and Abstracts Views on Vision4Press platform.
Data correspond to usage on the plateform after 2015. The current usage metrics is available 48-96 hours after online publication and is updated daily on week days.
Initial download of the metrics may take a while.