Fig. C.2.
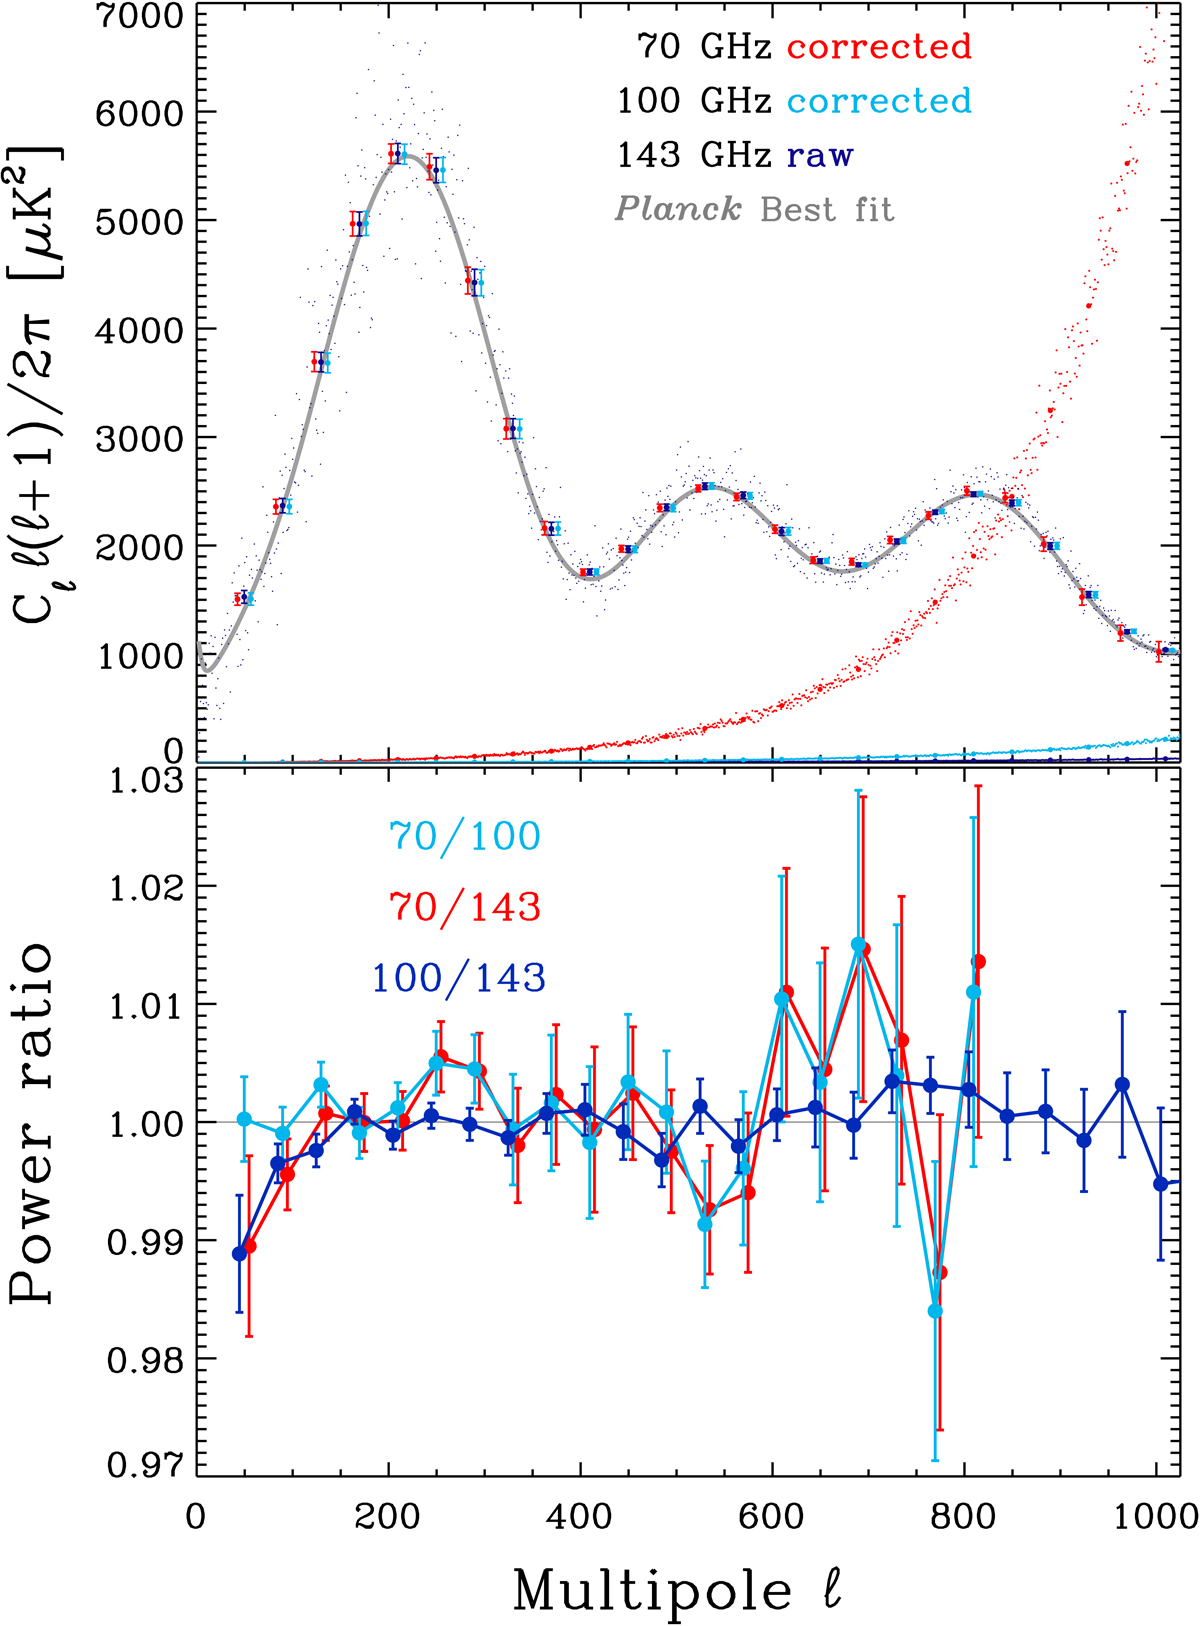
Power spectra of 70, 100, and 143 GHz maps evaluated after masking approximately 40% of the sky. Top: cross-spectra of half-ring maps at 70 GHz and half-mission maps at 100 and 143 GHz, as well as the spectra of the half-difference maps, which illustrate the noise content of the data. Binned 143 GHz raw cross-spectrum values indicate the bin centres; the other spectral values are spread in the bins for clarity (see further details in text). Bottom: power ratios of the same spectra. The drop in the values of some ratios at ℓ < 150 is due to uncorrected diffuse foreground emission that gets brighter at 143 GHz outside the masked part of the Galaxy. At ℓ > 150 there is excellent consistency of all three spectra. One can see that at the top of the first acoustic peak near ℓ ≃ 220 they are consistent at the level of a few ×10−3.
Current usage metrics show cumulative count of Article Views (full-text article views including HTML views, PDF and ePub downloads, according to the available data) and Abstracts Views on Vision4Press platform.
Data correspond to usage on the plateform after 2015. The current usage metrics is available 48-96 hours after online publication and is updated daily on week days.
Initial download of the metrics may take a while.