Fig. C.1.
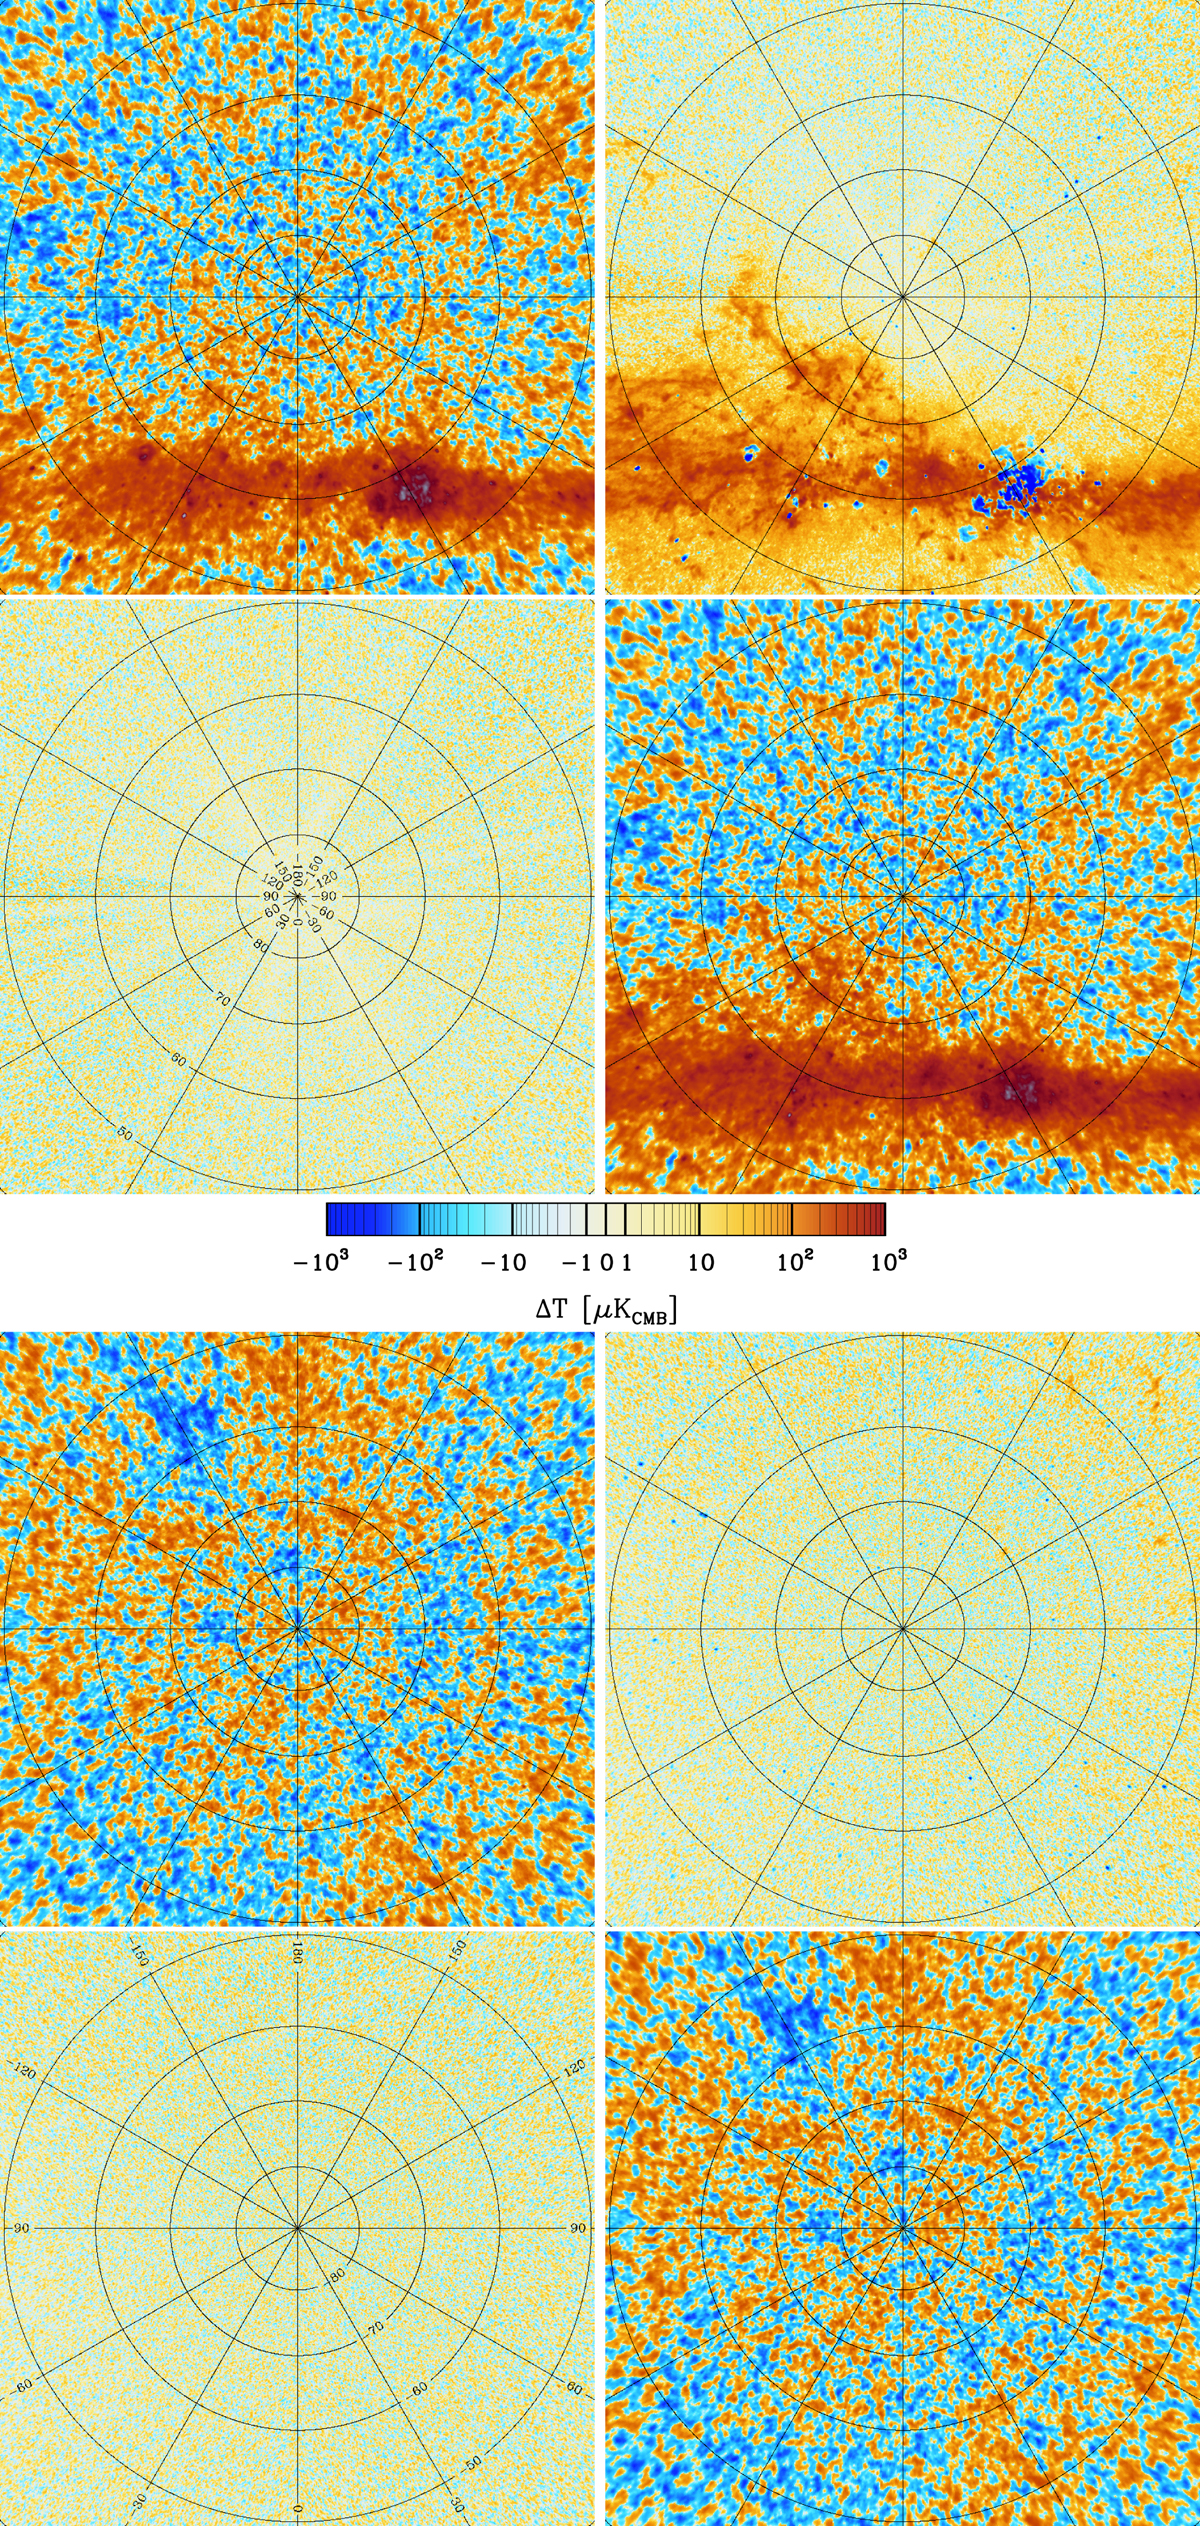
HFI and LFI maps and differences. Top: north ecliptic pole region. The four panels are: upper-left, 70 GHz; lower-right, 100 GHz; upper-right, 100 GHz − 70 GHz; and lower-left, difference of 70 GHz half-ring and 100 GHz half-mission difference maps. The frequency difference map demonstrates excellent visual consistency of the measured CMB anisotropies, and reveals diffuse foregrounds and point sources, specifically positive dust and CO emission and negative free-free and synchrotron emission. Note the large Cygnus region in the Galactic plane. Bottom: south Galactic pole region, with the same 4-panel layout as for the top part. We note the dust haze in the upper right part of the difference panel and the large, negative CMB fluctuation in the upper left of the 70 and 100 GHz frequency maps, called the Cold Spot.
Current usage metrics show cumulative count of Article Views (full-text article views including HTML views, PDF and ePub downloads, according to the available data) and Abstracts Views on Vision4Press platform.
Data correspond to usage on the plateform after 2015. The current usage metrics is available 48-96 hours after online publication and is updated daily on week days.
Initial download of the metrics may take a while.