Fig. 1.
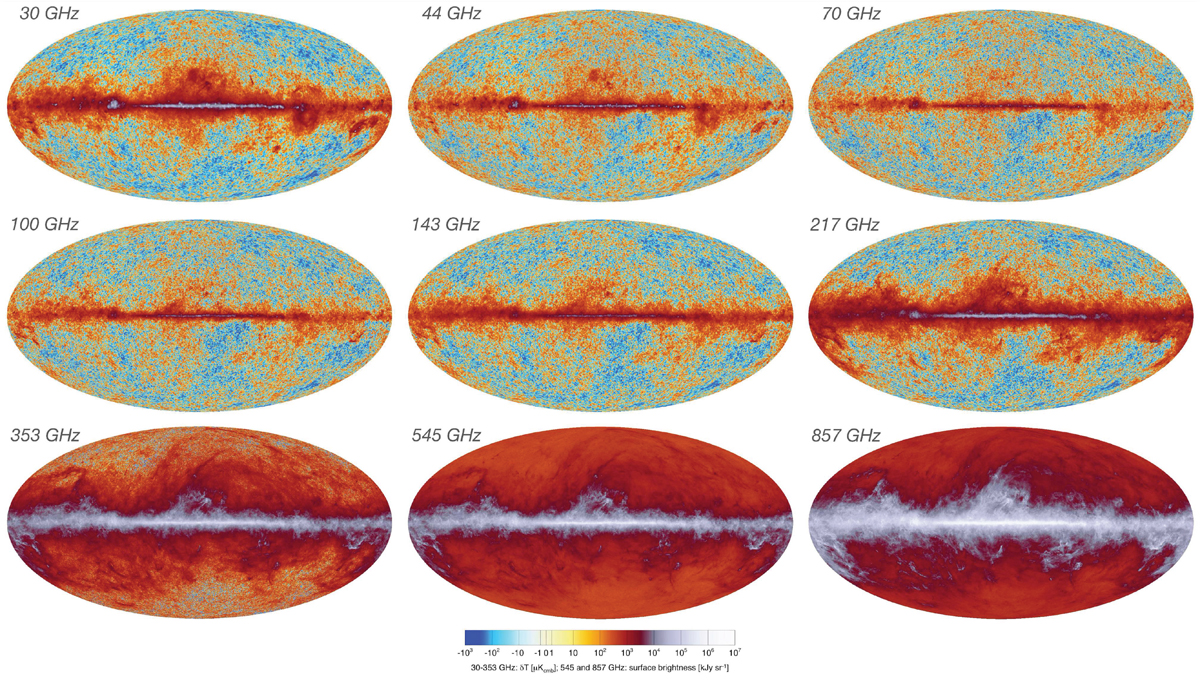
Fluctuations of sky emission in each of nine Planck frequency bands, after removal of a common dipole component. The fluctuations are expressed as equivalent temperature variations at each of the seven lowest frequencies, so that fluctuations with a thermal spectrum will appear the same in each map (except for the effects of the varying resolution of the maps). The highest frequencies, which monitor the dust emission, are expressed in more conventional units.
Current usage metrics show cumulative count of Article Views (full-text article views including HTML views, PDF and ePub downloads, according to the available data) and Abstracts Views on Vision4Press platform.
Data correspond to usage on the plateform after 2015. The current usage metrics is available 48-96 hours after online publication and is updated daily on week days.
Initial download of the metrics may take a while.