Open Access
Fig. 26.
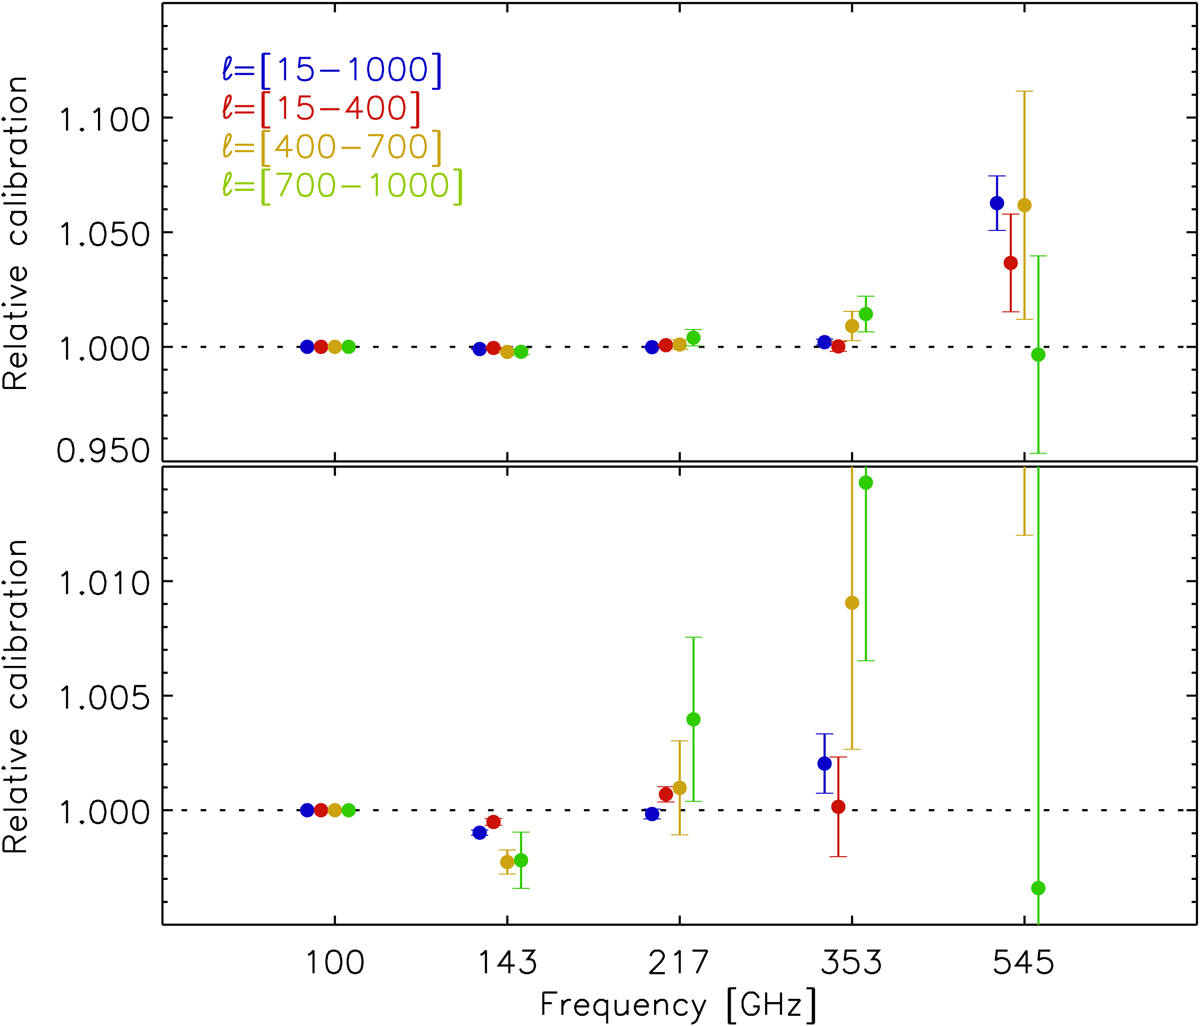
Inter-band calibration relative to 100 GHz, expressed as factors for the maps, measured on power spectra in a broad range (15 < ℓ < 1000), and on the three bands around the first (15 < ℓ < 400), second (400 < ℓ < 700), and third (700 < ℓ < 1000) acoustic peaks. Bottom panel: enlargement of part of the top one.
Current usage metrics show cumulative count of Article Views (full-text article views including HTML views, PDF and ePub downloads, according to the available data) and Abstracts Views on Vision4Press platform.
Data correspond to usage on the plateform after 2015. The current usage metrics is available 48-96 hours after online publication and is updated daily on week days.
Initial download of the metrics may take a while.