Open Access
Fig. 16.
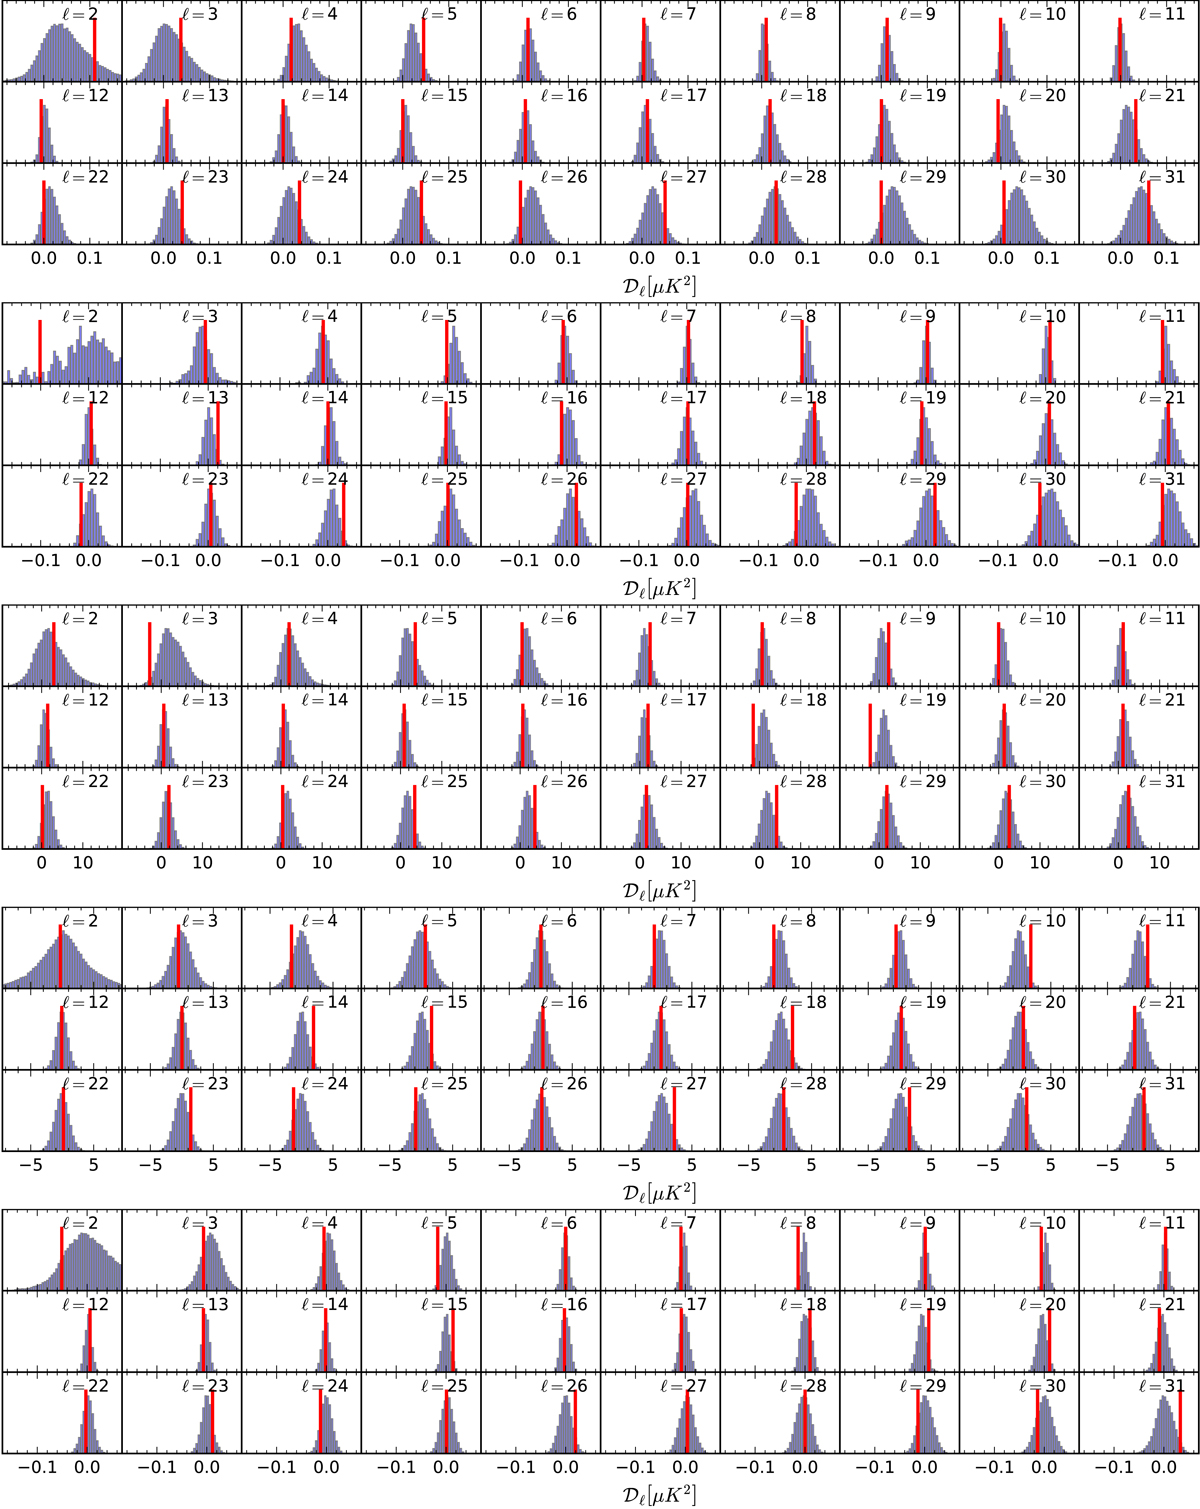
Probability distribution for each multipole (ℓ = 2–31) of the 100 × 143 cross-spectra, from the top panels to the bottom ones, showing EE, BB, TE, TB, and EB. Red vertical lines show the values for the data. The associated PTEs are given in Table 4.
Current usage metrics show cumulative count of Article Views (full-text article views including HTML views, PDF and ePub downloads, according to the available data) and Abstracts Views on Vision4Press platform.
Data correspond to usage on the plateform after 2015. The current usage metrics is available 48-96 hours after online publication and is updated daily on week days.
Initial download of the metrics may take a while.