Open Access
Fig. 13.
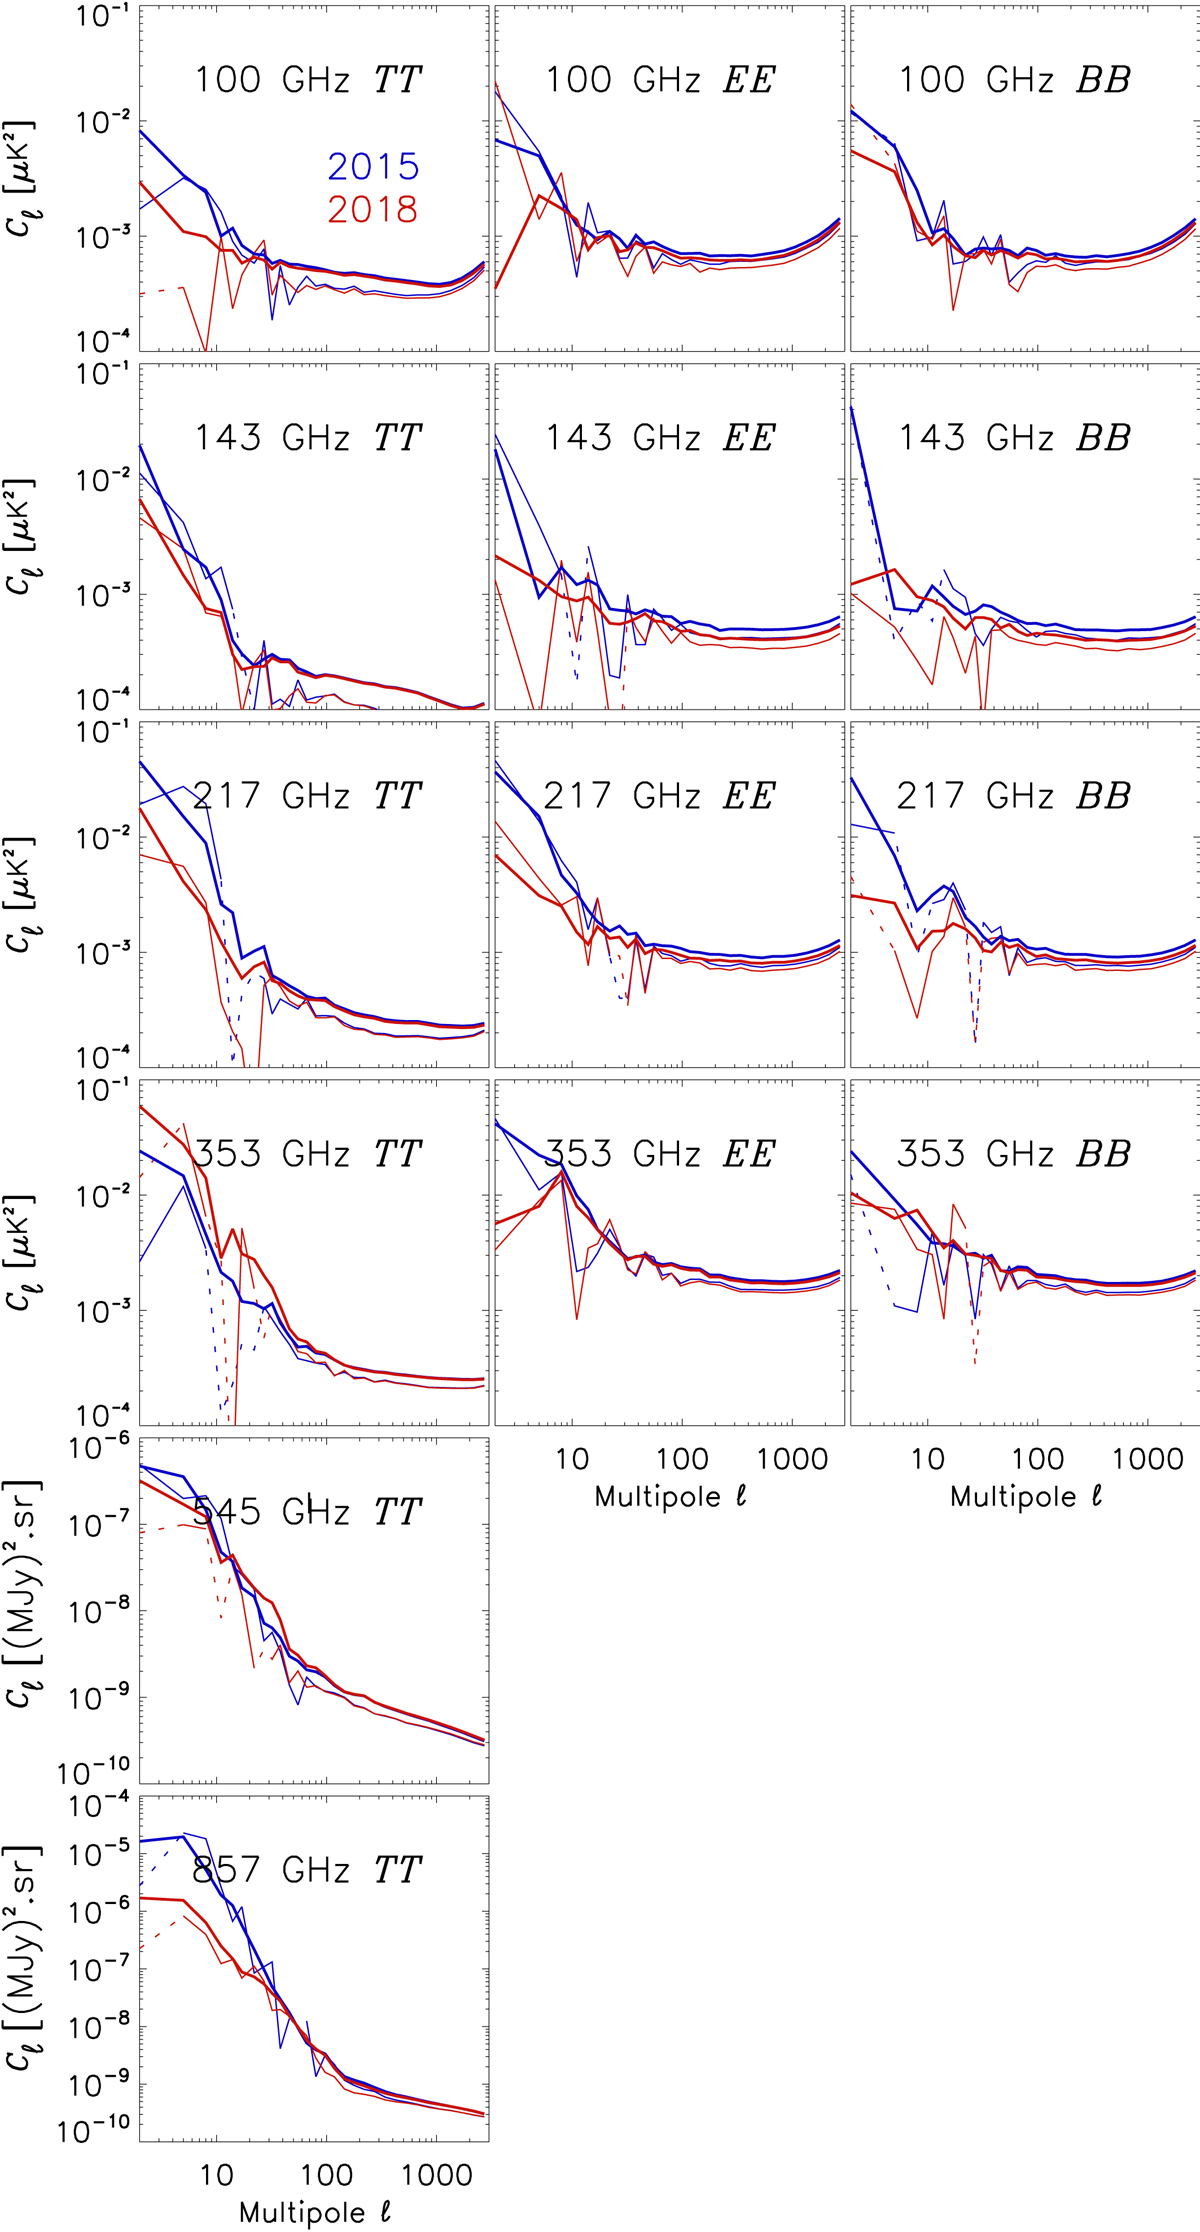
Power spectra of the maps shown in Fig. 12 not corrected for the sky fraction. Here blue is for the 2015 data and red for 2018. Thick and thin lines are for sky fractions of 43% and 80%, respectively. Dashed lines indicate negative values.
Current usage metrics show cumulative count of Article Views (full-text article views including HTML views, PDF and ePub downloads, according to the available data) and Abstracts Views on Vision4Press platform.
Data correspond to usage on the plateform after 2015. The current usage metrics is available 48-96 hours after online publication and is updated daily on week days.
Initial download of the metrics may take a while.