Fig. 12.
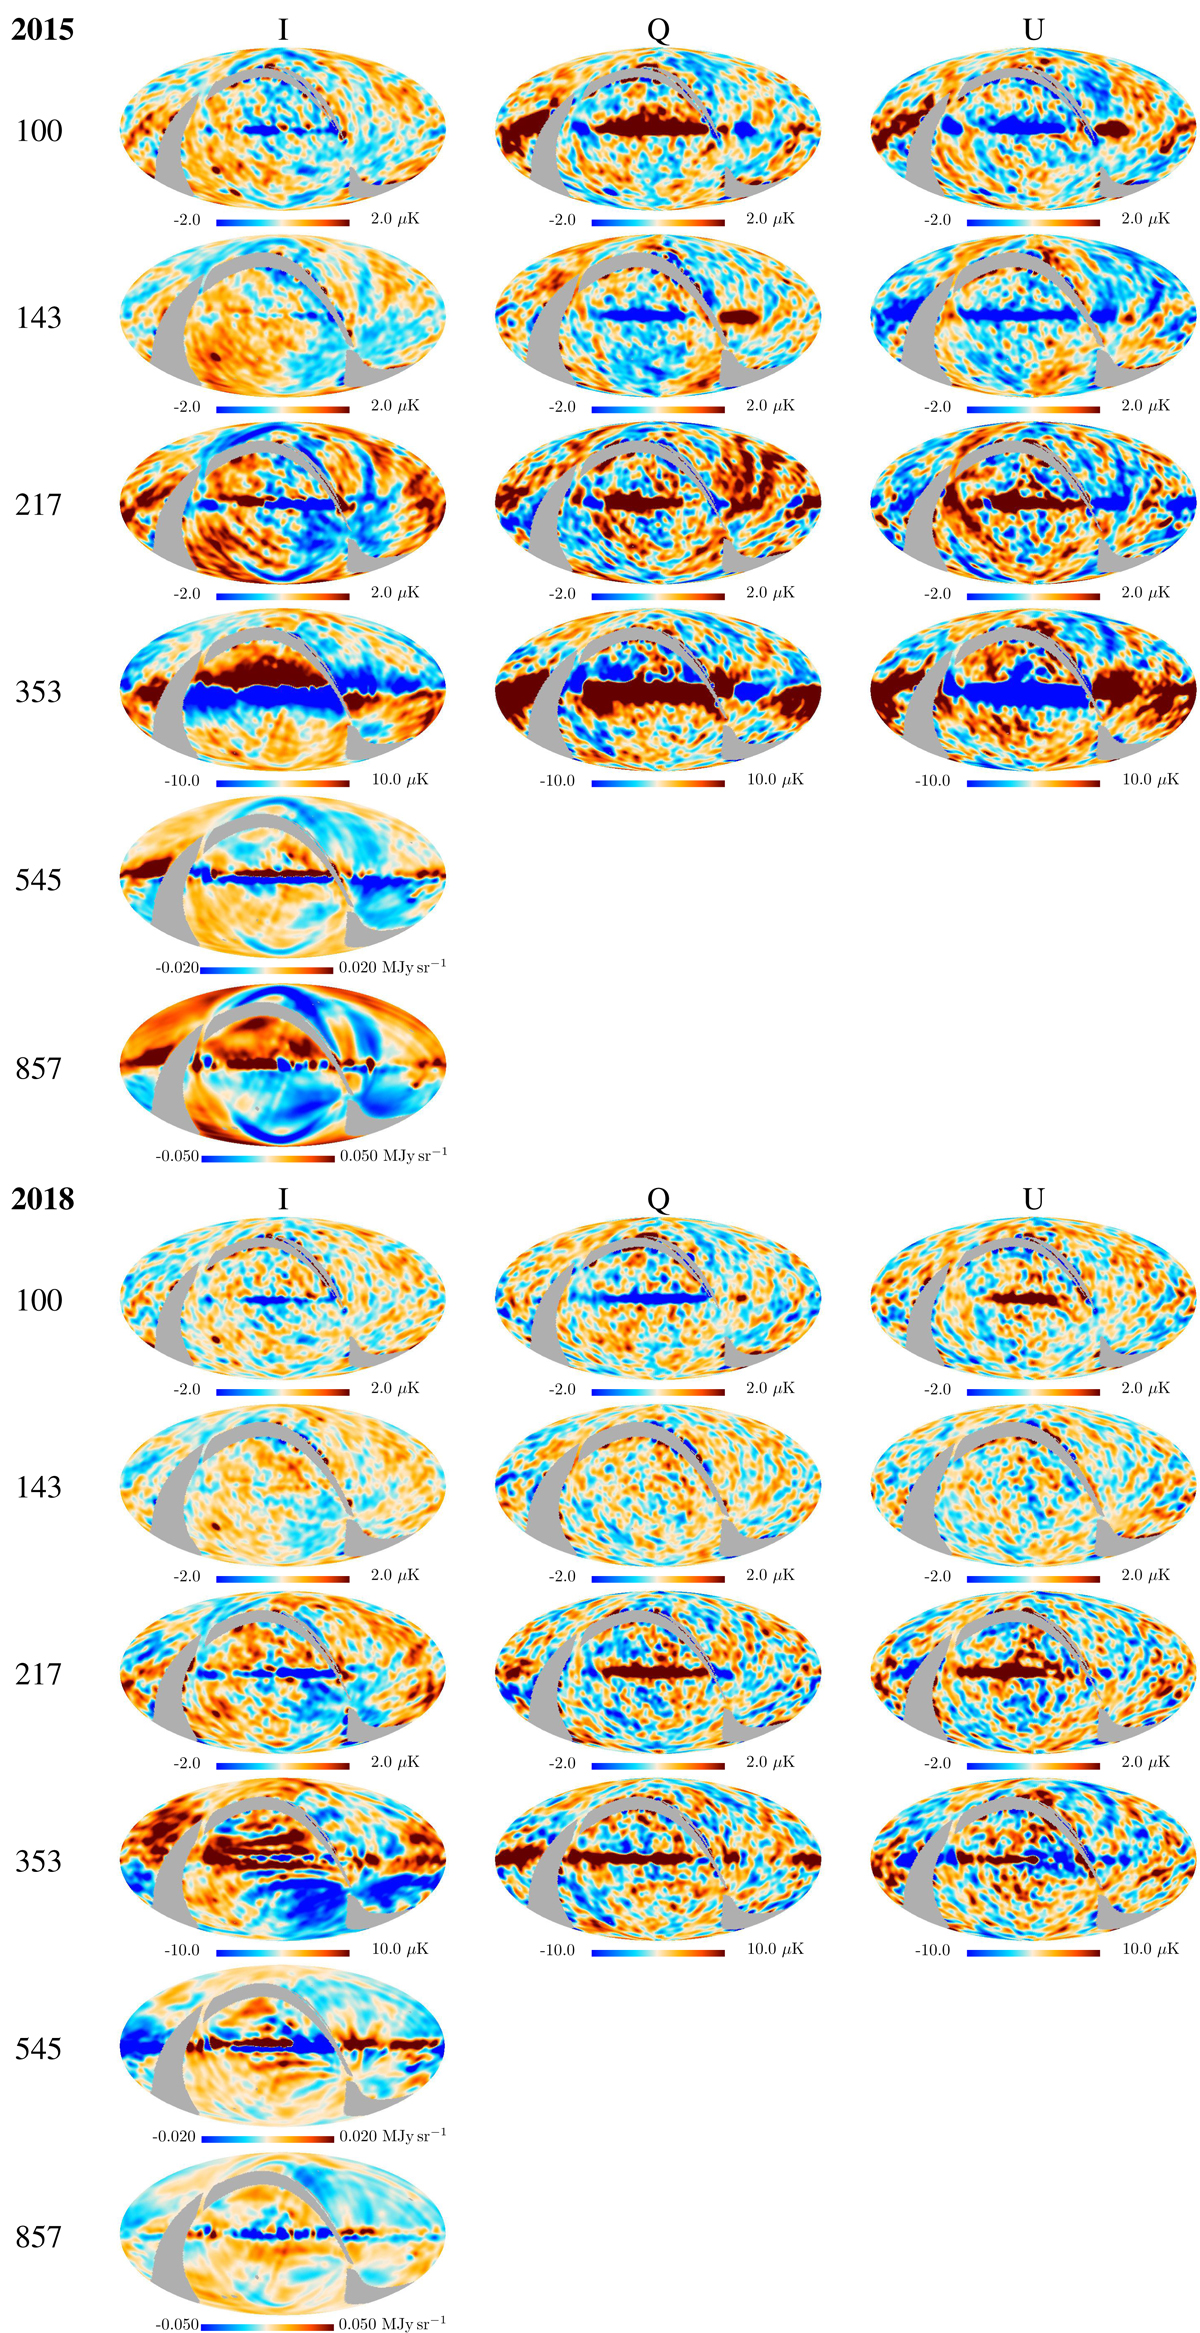
Survey differences of the full-mission ((S1 + S3) − (S2 + S4)) maps in I, Q, and U (in columns) for the 2015 data (top panels) and the 2018 data (bottom panels). There are large improvements at CMB frequencies in the residuals for the 2018 data compared to those in the 2015 data. Bands are visible in the 353 GHz and 545 GHz intensity maps, due to the incomplete correction of the transfer function.
Current usage metrics show cumulative count of Article Views (full-text article views including HTML views, PDF and ePub downloads, according to the available data) and Abstracts Views on Vision4Press platform.
Data correspond to usage on the plateform after 2015. The current usage metrics is available 48-96 hours after online publication and is updated daily on week days.
Initial download of the metrics may take a while.