Fig. 3.
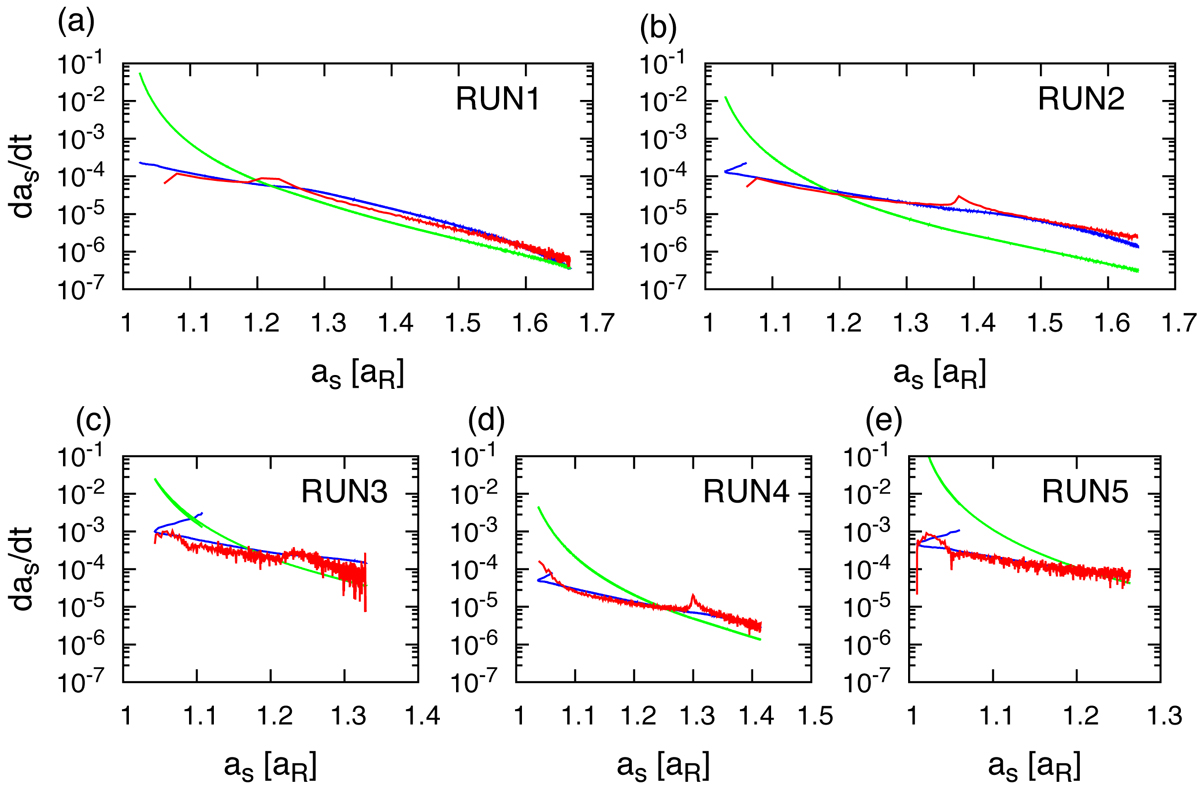
Orbital expansion rate, das/dt, as a function of as in RUN1 to RUN5. The red curves are the results of individual N-body simulations. The blue and green curves are the theoretical predictions of (das/dt)res and (das/dt)self given respectively by Eqs. (9) and (11) using Ms and Mdisk obtained by the N-body simulations at individual as in each run.
Current usage metrics show cumulative count of Article Views (full-text article views including HTML views, PDF and ePub downloads, according to the available data) and Abstracts Views on Vision4Press platform.
Data correspond to usage on the plateform after 2015. The current usage metrics is available 48-96 hours after online publication and is updated daily on week days.
Initial download of the metrics may take a while.