Fig. 2.
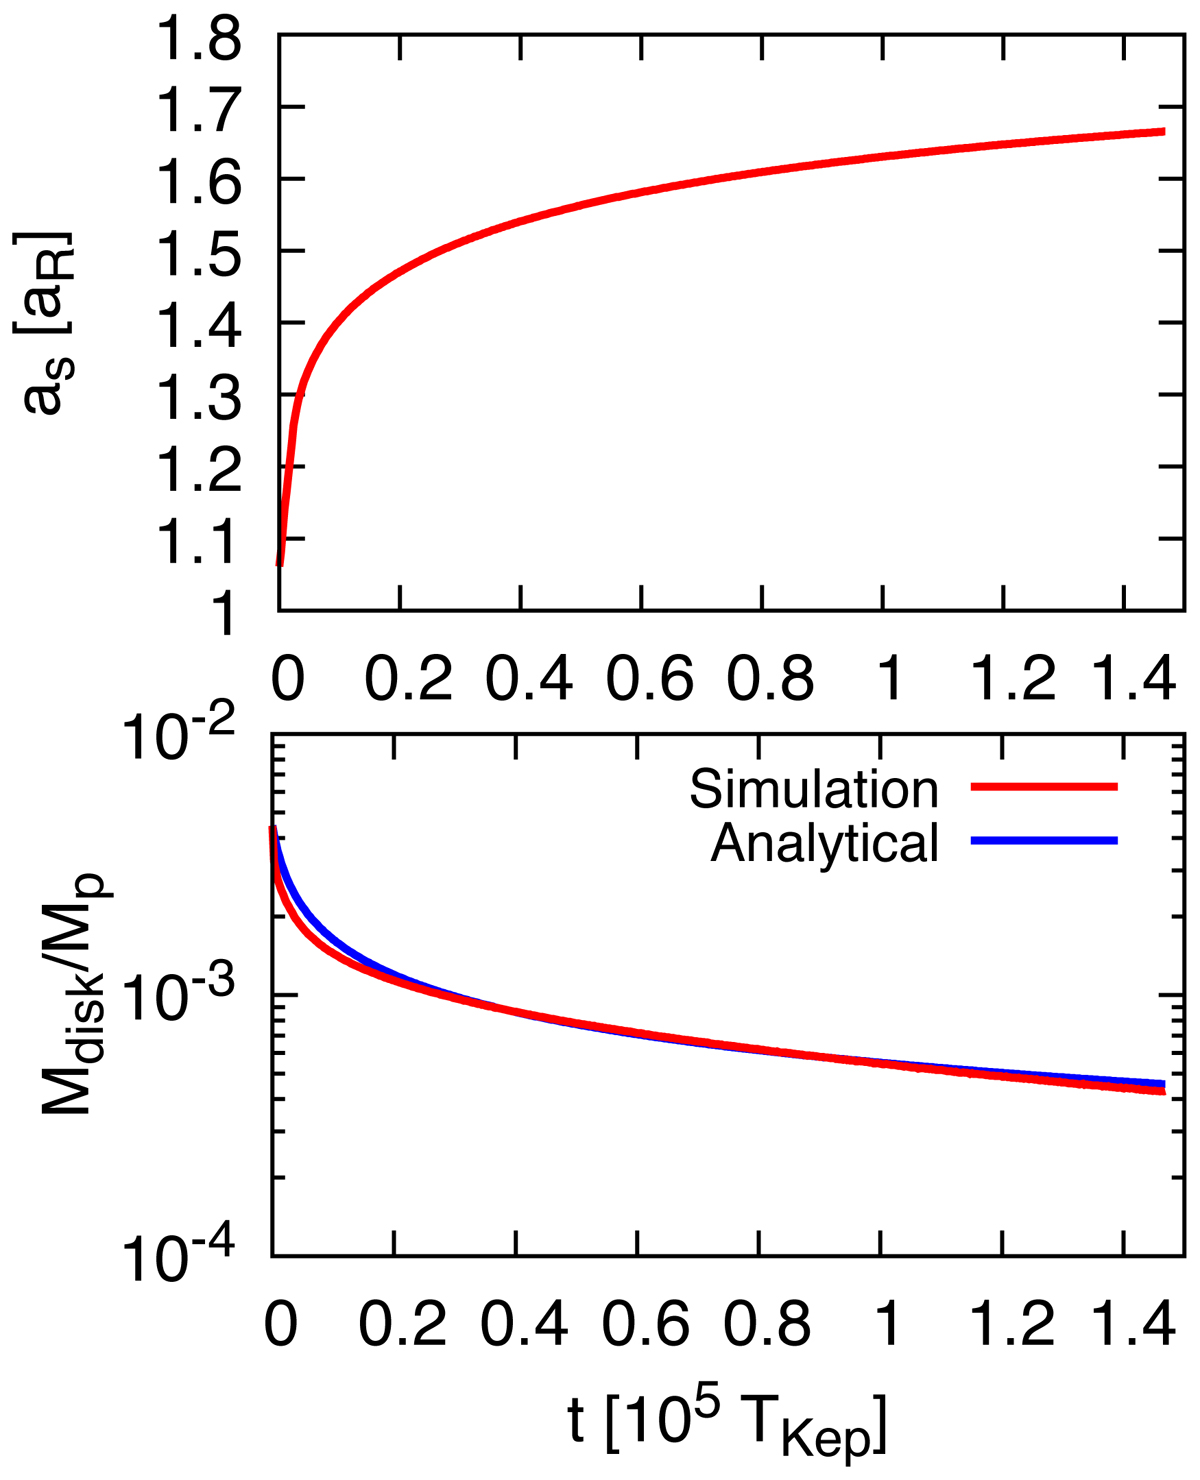
Time evolution of the satellite’s semimajor axis (as; upper panel) and the disk mass (Mdisk; lower panel). The units of the semimajor axis and the time are the Roche limit radius aR and the Keplerian period at aR, respectively. The red curves are the results of RUN1 and the blue curve in the lower panel is the analytical estimation given by Eq. (8).
Current usage metrics show cumulative count of Article Views (full-text article views including HTML views, PDF and ePub downloads, according to the available data) and Abstracts Views on Vision4Press platform.
Data correspond to usage on the plateform after 2015. The current usage metrics is available 48-96 hours after online publication and is updated daily on week days.
Initial download of the metrics may take a while.