| Issue |
A&A
Volume 640, August 2020
|
|
|---|---|---|
| Article Number | L2 | |
| Number of page(s) | 5 | |
| Section | Letters to the Editor | |
| DOI | https://doi.org/10.1051/0004-6361/202038504 | |
| Published online | 28 July 2020 | |
Letter to the Editor
Detection of the magnetar XTE J1810−197 at 150 and 260 GHz with the NIKA2 kinetic inductance detector camera
1
Instituto de Radioastronomía Milimétrica (IRAM), Avda. Divina Pastora 7, Local 20, 18012 Granada, Spain
e-mail: This email address is being protected from spambots. You need JavaScript enabled to view it.
2
East Asian Observatory, 660 N. A’ohoku Place, University Park, Hilo, HI 96720, USA
3
Laboratoire de Physique Subatomique et de Cosmologie, Université Grenoble-Alpes, CNRS, 53 Av. des Martyrs, 38026 Grenoble, France
4
Institut d’Astrophysique Spatiale (IAS), CNRS and Université Paris-Sud, Bâtiment 121, Orsay, France
5
Laboratoire de Physique de l’École Normale Supérieure, ENS, 24 rue Lhomond, 75005 Paris, France
6
Institut de Radioastronomie Millimétrique (IRAM), 300 rue de la Piscine, 38406 St. Martin d’Hères, France
7
Institut Néel, CNRS and Université Grenoble-Alpes, 25 rue des Martyrs BP 166, 38042 Grenoble, France
8
LESIA, Observatoire de Paris, Université PSL, CNRS, Sorbonne Université, Université de Paris, 5 place Jules Janssen, 92195 Meudon, France
9
Max-Planck-Institut für Radioastronomie, Auf dem Hügel 69, 53121 Bonn, Germany
10
Jodrell Bank Centre for Astrophysics, School of Physics and Astronomy, University of Manchester, Manchester M13 9PL, UK
Received:
27
May
2020
Accepted:
3
July
2020
Abstract
Context. The investigation of pulsars between millimetre and optical wavelengths is challenging due to the faintness of the pulsar signals and the relative low sensitivity of the available facilities compared to 100 m class telescopes operating in the centimetre band. The kinetic inductance detector (KID) technology offers large instantaneous bandwidths and a high sensitivity that can help to increase the ability of existing observatories at short wavelengths substantially to detect pulsars and transient emission.
Aims. To investigate whether pulsars can be detected with KIDs, we observed the anomalous X-ray pulsar XTE J1810−197 with the New IRAM KIDs Array-2 (NIKA2) camera installed at the IRAM 30 m telescope in Spain.
Methods. Several short observations of XTE J1810−197 were made on 2019 March 25 under good weather conditions to verify the stability of the KIDs and to try to detect the expected broadband pulsations from the neutron star.
Results. We detected the pulsations from the pulsar with NIKA2 at its two operating frequency bands, 150 and 260 GHz (λ = 2.0 and 1.15 mm, respectively). This is the first time that a pulsar is detected with a receiver based on KID technology in the millimetre band. In addition, this is the first report of short millimetre emission from XTE J1810−197 after its reactivation in December 2018, and it is the first time that the source is detected at 260 GHz, which gives us new insights into the radio emission process of the star.
Conclusions. We demonstrate that KIDs can fulfil the technical requirements for detecting pulsed emission from neutron stars in the millimetre band. We show that the magnetar XTE J1810−197 is again emitting strong pulsations in the short millimetre band.
Key words: stars: magnetars / pulsars: individual: XTE J1810−197 / radiation mechanisms: non-thermal / instrumentation: detectors
© ESO 2020
1. Introduction
Pulsars are rotating neutron stars that emit broadband-beamed emission that is detectable as pulses from Earth as their beams cross our line of sight. They act like cosmic clocks, and studying them enables high-precision astronomy (e.g. Kramer et al. 2006; Eatough et al. 2013; Cromartie et al. 2020). Nevertheless, the mechanism of their coherent radio emission is still unknown (for a review, see e.g. Melrose 2017).
One way to better understand the coherent and incoherent components of pulsar emission and aid constraining theoretical models is to measure the spectrum of pulsars in the poorly explored window between the radio and optical regimes (e.g. Michel 1978). However, pulsars in general are steep spectral sources in the radio band, which means that their emission is extremely weak above a few gigaherz (Maron et al. 2000). Additionally, with higher frequencies, the collecting areas and efficiency of the available telescopes tend to decrease, and instrumentation with a high enough time resolution to resolve the pulsations is rarely available. As a result, pulsar studies in the millimetre, infrared, and optical regimes are sparse and highly challenging.
To improve our ability to detect and study pulsars at short wavelengths, we need higher sensitivity. One solution is to use large-bandwidth and low-noise receivers. In recent years, a new technology based on kinetic inductance detectors (KIDs) has been used to fabricate sensitive large-array detectors (for a review, see Mauskopf 2018). KID arrays of thousands of pixels can be built and operated with the most advanced sensitivity (Monfardini et al. 2011; Mazin et al. 2013; Catalano et al. 2014; Calvo et al. 2016; Perotto et al. 2020).
Furthermore, KIDs are fast detectors, with typical time constants of about 100 μs (Catalano et al. 2016; Monfardini et al. 2016), and they can be used at very high sampling rates up to few megaherz (Swenson et al. 2010; Bourrion et al. 2016; Fasano et al. 2020). This makes KIDs a promising tool for investigating pulsars in unexplored sections of their spectrum and test models of pulsar magnetospheres.
The KID-based NIKA2 camera installed at the IRAM 30 m telescope (Adam et al. 2018) is a dual wide-band camera operating simultaneously at 150 and 260 GHz (λ = 2.0 and 1.15 mm) with 45 GHz of bandwidth and a total of 2896 KIDs cooled down to about 150 mK (Calvo et al. 2016). NIKA2 offers an excellent performance with typical sensitivities per detector of 9 and 30 mJy s1/2 at 150 and 260 GHz, respectively (Perotto et al. 2020). In the future, NIKA2 will also offer polarisation measurements in the 260 GHz band (Ritacco et al. 2020). Currently, the maximum theoretical sampling frequency of NIKA2 is 500 Hz1.
The observations presented here focus on the anomalous X-ray pulsar XTE J1810−197. This pulsar was identified as a magnetar in 2003 after a sudden increase in its X-ray luminosity (Ibrahim et al. 2004). Magnetars are a small family of pulsars whose high-energy luminosity cannot be accounted for solely by the spin-down energy, and they are thought to be powered in addition by magnetic field decay (for a review on magnetar properties, see e.g. Kaspi & Beloborodov 2017). XTE J1810−197 was furthermore the first magnetar to exhibit radio emission (Halpern et al. 2005; Camilo et al. 2006), an uncommon property that only five of the known 23 known magnetars have shown to date. Interestingly, and in contrast to the majority of the pulsar population, radio magnetars share a tendency to maintain a flat or even inverted spectrum in the radio band (Levin et al. 2010; Camilo et al. 2007, 2008; Torne et al. 2015). Radio magnetars can therefore be very bright in the millimetre band (Torne et al. 2017).
XTE J1810−197 is highly variable, and its radio emission ceased about three years after the discovery of the radio pulsations (Camilo et al. 2016). However, radio emission from the neutron star was re-detected in December 2018 (Levin et al. 2019), and follow-up campaigns at several wavelengths including X-ray (Gotthelf et al. 2019) confirmed that the source entered a new period of intense radiative activity. Observations were also carried out with the Superconductor-Insulator-Superconductor (SIS) Eight Mixer Receiver (EMIR, Carter et al. 2012) at the IRAM 30 m telescope, confirming that the source was also bright in the millimetre band. These observations will be presented elsewhere, but they confirmed that XTE J1810−197 was a good candidate for trying to observe it with NIKA2 and test whether the KIDs are able to detect broadband pulsations in the millimetre band.
2. Dataset and methods
2.1. Observations
XTE J1810−197 was observed on 2019 March 25 with the NIKA2 camera at the IRAM 30 m telescope under good weather conditions ( ). The KID arrays were configured to sample at a standard frequency Fs = 23.84 Hz, which is enough to obtain 132 data points across one rotational period of the pulsar (P ≈ 5.54 s). The observing mode was set to stare mode, in which the telescope continuously tracked the source at a fixed position on the three arrays of the camera.
The resonance frequency of each detector in NIKA2 is proportional to the input signal, and signal variations translate into resonance shifts. During the observations, we measure the signal via the amplitude and phase shift (transfer function) of a specific microwave test tone for each detector (Calvo et al. 2016). Prior to an observation, the detectors and readout are tuned to adapt the response to the input background signal from the sky. To ensure a coherent time series, the data were acquired continuously during each full scan and were recorded into a single data file.
In total, we recorded four scans of XTE J1810−197, the first two with 10 min duration each, and the last two with 15 min duration each. The maximum integration time per scan was set to ensure efficient and manageable data processing.
2.2. Data processing
The exact position of the magnetar on the KID arrays was a priori only known to a certain precision. To search for the exact pixels on which the source was centred, we wrote as 32 bit float time series the values of reconstructed signal (in resonance frequency units) from a number of pixels around the estimated position, corresponding to an area on sky of about 1 arcmin2. Because the pixel size and separation are different for the 2 and 1.15 mm arrays, time series from 45 pixels (slightly larger area) were extracted for the 2 mm array (called A2), and 77 and 84 pixels for the two arrays at 1.15 mm (called A1 and A3, respectively). The difference in the number of pixels for the two 1.15 mm arrays is due to a slightly larger number of non-valid pixels in array A3 (Perotto et al. 2020).
Next, we filtered the time series to subtract the atmospheric variations. We applied a running-fit filter consisting of a moving window of 4.5 s. As the window moves, a first-order polynomial is fit and subtracted from the data. Each filtered time series (i.e. from each extracted KID pixel) was then directly folded by the routine prepfold from the pulsar analysis suite PRESTO2. An ephemeris from Camilo et al. (2016), obtained from the pulsar database PSRCAT3 (Manchester et al. 2005), was used to predict the spin period at the observation epochs. The resulting pulsar candidate plots were manually inspected to identify the time series, and so the KID pixel of each array that contained the best signal in terms of signal-to-noise ratio at the spin period of XTE J1810−197. The KID pixels containing the highest-significance pulsations were KH097, KC016, and KP018 for the A1, A2, and A3 array, respectively.
A running-fit (or running-median or mean) filtering tends to subtract part of the pulsar signal, which affects the intensity measurements. For this reason, we re-processed the data after the pixels that contained the magnetar signal were identified. In this re-processing, we used a so-called multi-pixel filter. This method exploits the advantage of having multiple beams on the sky and removes the atmospheric variations, but preserves the pulsations unchanged. For 150 GHz, we selected pixels pointed on the sky between 2 and 3 half-power beam widths (HPBW, θ150 ≈ 17.7 arcsec) around the magnetar. Because the detectors are less sensitive and the atmospheric fluctuations stronger, we selected pixels at 260 GHz that pointed somewhat closer, between 1.25 and 2.5 HPBWs (θ260 ≈ 11.2 arcsec). From this subset, the pixels showing residual pulsations at any signal-to-noise ratio (as found with the running-fit filter) were flagged and excluded from the analysis. For the remaining pixels (17 pixels for A2, 14 pixels for A1 and A3), a running median with a window of 1.5 s was applied, and the resulting running median vectors were averaged and subtracted from the time series centred on the magnetar. This was done separately for arrays A1, A2, and A3. The time series at 260 GHz still showed some residual slow fluctuations after this procedure. In these cases, a final smoothing by a running median of window 5 s was applied. This filtering method resulted in a clean average profile with a flat off-pulse region, and without the typical dips resulting from direct running median or running fit subtractions.
Finally, the time series cleaned with the multi-pixel filter were reformatted as SIGPROC4 filterbank-type files by adding a header containing the metadata of the observation. The binary formatting of the header was made with tools from SIGPYPROC5. To increase the total signal-to-noise ratio, the four individual scans were concatenated by letting prepfold pad the gaps in between scans. For the 260 GHz frequency, arrays A1 and A3 receive half of the total power each. Before concatenation and folding, the time series from the orthogonal linearly polarised pixels KH097 and KP018 were therefore combined to produce the total intensity output.
2.3. Calibration
To convert into flux density units, and prior to the analysis presented in Sect. 2.2, we scaled the time series by calibration factors obtained from observations of Uranus taken in September 2018 and March 2019 (see Perotto et al. 2020, for details of the NIKA2 calibration). These observations were also used to compute the relative sky position between detectors. A correction was applied to the intensity at 260 GHz to account for a slight misalignment of the beams from pixels KH097 and KP018 with respect to the position on sky of pixel KC016. The distance between the beams at 150 and 260 GHz for the pixels we used was 4.5 arcsec. The correction includes a pointing offset of 2 arcsec from the magnetar position. The beam misalignment plus pointing offset result in an increase by a factor of two for the 260 GHz intensity. The uncertainties are derived from the noise statistics, combined with a 6 and 10% 1σ error for the 150 and 260 GHz bands, respectively, that originates from the scaling to Jansky factors (Perotto et al. 2020), combined with a 10% 1σ error for the correction due to the misalignment of the beams.
3. Results and discussion
The magnetar XTE J1810−197 was clearly detected in both bands of the NIKA2 camera at central frequencies 150 and 260 GHz (λ = 2.0 and 1.15 mm), with peak significances of 124σ and 13σ, respectively. Figure 1 shows the average profiles and signal intensities as a function of integration time. At 150 GHz we detect individual pulsations in almost every rotation of the magnetar (see Fig. 2).
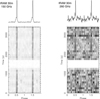 |
Fig. 1. Average profiles (shown twice for clarity) of the detection of XTE J1810−197 with NIKA2 at 150 GHz (left) and 260 GHz (right). Profiles have 128 bins, corresponding to a time resolution of ≈43 ms on the horizontal axis. Bottom panels: signal intensity over time with 1.7 min resolution on the vertical axis. The white gap corresponds to the time when the telescope did not observe the source. |
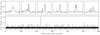 |
Fig. 2. Single-pulse activity from XTE J1810−197 during our observations with NIKA2 on 2019 March 25. Only the last 10 min of the observation at 150 GHz are shown for clarity, but the activity is similar for the total 50 min on-source. No single pulses are detected at 260 GHz, which may be an effect of spectral index and instrumental sensitivity. Upper panels: zoom (1.25 s around the peak) into a selection of six pulses, and they share the y-axis scale in Jansky units. Bottom panel: 10 min time series. The time resolution in all panels is ≈42 ms, limited by the sampling frequency set for the KID arrays. Many pulses show structure. Most pulses are unresolved. |
Table 1 presents the continuum-equivalent (or averaged) flux density (i.e. the area below the pulse divided by the rotational period) and derived spectral index. The spectrum and fit are shown in Fig. 3. With S150 = 11.7 ± 0.7 mJy and S260 = 6.4 ± 1.0 mJy, the average spectral index is α = −1.1 ± 0.3 (for Sν ∝ να). Because we have only a few data points and to better estimate the uncertainties, the spectral index was fit in a Markov chain Monte Carlo (MCMC) analysis using the Python package emcee6 (Foreman-Mackey et al. 2013).
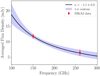 |
Fig. 3. Emission spectrum in the millimetre band of the radio magnetar XTE J1810−197 during the observations with NIKA2 on 2019 March 25. The solid black line indicates the mean value, and the shaded blue region encompasses the 68% confidence interval. The spectral index is α = −1.1 ± 0.3 (for Sν ∝ να). |
XTE J1810−197 measured properties at the epoch of observation (2019 March 25).
The resulting spectrum is relatively flat, although much steeper than the inverted spectrum measured between 0.7−4.0 GHz (α ≈ + 0.3, Dai et al. 2019). The millimetre flux density is about nine times higher than what can be estimated from the light curve reported by Maan et al. (2019) (≈1.0 mJy at 650 MHz). When we include this low-frequency value, the spectral fit would result in α ≈ +0.39 ± 0.02, consistent with the derived value at lower frequency. The difference in spectral index resulting from using the millimetre data alone might be related to a poor constraint of the fit with only two data points. However, interstellar scintillation (see the discussion in Lazaridis et al. 2008) and/or a frequency-dependent intrinsic variability of the magnetar emission may also play a role. We measured variations in the flux density of up to 50% peak to peak during our observations (in scales of tens of minutes), which supports the variability scenario. We should simultaneously consider that the spectrum of XTE J1810−197 may not always be well described over wide frequency ranges by a single power law. This is consistent with the spectral turnover reported by Dai et al. (2019) and has been observed for other radio magnetars (Camilo et al. 2008; Torne et al. 2017). A conclusive answer for the spectral shape between centimetre and millimetre wavelengths, which would enable testing the radio emission mechanism (e.g. revealing spectral turn-ups, Michel 1978), requires simultaneous multi-frequency observations.
The single pulsations at 150 GHz allow an estimation of the brightness temperature of the emission region, enabling us to test whether the millimetre emission is still coherent. For a distance to XTE J1810−197 of 3.5 ± 0.5 kpc (Minter et al. 2008) and a typical detected 0.75 Jy pulse, the brightness temperature at 150 GHz is TB > 1017 K (see e.g. Lorimer & Kramer 2005). We set the value as a lower limit because the pulses are not resolved, and narrower pulses correspond (following a light travel-time argument) to smaller emitting regions and higher brightness temperatures. Even at the lower limit, this high brightness temperature rules out incoherent mechanisms for the production of the pulses (e.g. Singal 2009). We therefore conclude that the underlying mechanism that causes the emission at 150 GHz must still maintain a level of coherency. Without detected single pulses, we cannot constrain the emission mechanism at 260 GHz. We hypothesise, however, that because the continuum-equivalent flux density and pulse profile are so similar in the two frequency bands, the 260 GHz emission is probably caused by the same emission process. Additional observations with higher time-resolution are encouraged. They might help to further constrain the coherence of the emission mechanism by detecting narrower pulses7, perhaps also at 1.15 mm or even shorter wavelengths.
While XTE J1810−197 was detected in the 2 mm band during its previous epoch of activity in 2006 (at 144 GHz, λ = 2.08 mm, Camilo et al. 2007), this is the first detection of the source at 260 GHz (λ = 1.15 mm). The fact that we see again strong emission from XTE J1810−197 in the millimetre band, as in 2006, suggests that the radio emission process that has been reactivated now is the same as in the previous period of activity. In the 2 mm band, however, the emission is about ten times stronger than what was reported by Camilo et al. (2007).
The results presented here demonstrate that XTE J1810−197 produces strongly pulsed emission in the millimetre band after its reactivation in December 2018. The intrinsic variability of the source means that XTE J1810−197 opens a new opportunity of investigating the properties of pulsar emission at short millimetre wavelengths, where only another radio magnetar and two canonical pulsars have been detected above 50 GHz (Torne et al. 2015, 2017; Morris et al. 1997; Torne 2017; Liu et al. 2019). The current intensity and activity of this magnetar encourage observations at even shorter wavelengths, including submillimetre to optical bands.
Finally, we remark that this is the first time that KID technology as used in NIKA2 is successfully applied to detect broadband pulsations from neutron stars in the millimetre wavelength regime. In the future, the sampling frequency of NIKA2 may be increased, allowing for observations of faster-spinning pulsars or even burst emission of the kind of fast radio bursts (FRB, see e.g. Cordes & Chatterjee 2019).
4. Conclusions
The KID technology has the capability of detecting pulsations from neutron stars in the millimetre band, as demonstrated by these results for the magnetar XTE J1810−197 with the NIKA2 camera installed at the IRAM 30 m telescope. Similarly, KIDs may be applied at even shorter wavelengths to observe pulsars and transient emission.
The detections of XTE J1810−197 at 150 and 260 GHz (λ = 2.0 and 1.15 mm, respectively) are the first detections of the magnetar above 144 GHz, showing that the star is again emitting intense millimetre radiation after its reactivation in December 2018. The spectrum in the millimetre band is relatively flat, but steeper than what was seen at centimetre wavelengths. The brightness temperature of the individual pulsations supports the hypothesis that a coherent mechanism is the source of the millimetre emission.
This fast-sampling mode is pending commissioning.
Time scales for individual pulses at lower frequencies are ≲1 ms (Maan et al. 2019).
Acknowledgments
We thank the anonymous referee, Clemens Thum and Carsten Kramer for their constructive comments on the manuscript, and the NIKA2 team for supporting the observations. This work is based on observations carried out with the IRAM 30 m telescope. IRAM is supported by INSU/CNRS (France), MPG (Germany) and IGN (Spain). Financial support by the European Research Council for the ERC SynergyGrant BlackHoleCam (ERC-2013-SyG, Grant Agreement no. 610058) is gratefully acknowledged.
References
- Adam, R., Adane, A., Ade, P. A. R., et al. 2018, A&A, 609, A115 [NASA ADS] [CrossRef] [EDP Sciences] [Google Scholar]
- Bourrion, O., Benoit, A., Bouly, J. L., et al. 2016, J. Instrum., 11, P11001 [CrossRef] [Google Scholar]
- Calvo, M., Benoît, A., Catalano, A., et al. 2016, J. Low Temp. Phys., 184, 816 [NASA ADS] [CrossRef] [Google Scholar]
- Camilo, F., Ransom, S. M., Halpern, J. P., et al. 2006, Nature, 442, 892 [NASA ADS] [CrossRef] [PubMed] [Google Scholar]
- Camilo, F., Ransom, S. M., Peñalver, J., et al. 2007, ApJ, 669, 561 [NASA ADS] [CrossRef] [Google Scholar]
- Camilo, F., Reynolds, J., Johnston, S., Halpern, J. P., & Ransom, S. M. 2008, ApJ, 679, 681 [NASA ADS] [CrossRef] [Google Scholar]
- Camilo, F., Ransom, S. M., Halpern, J. P., et al. 2016, ApJ, 820, 110 [NASA ADS] [CrossRef] [Google Scholar]
- Carter, M., Lazareff, B., Maier, D., et al. 2012, A&A, 538, A89 [NASA ADS] [CrossRef] [EDP Sciences] [Google Scholar]
- Catalano, A., Calvo, M., Ponthieu, N., et al. 2014, A&A, 569, A9 [NASA ADS] [CrossRef] [EDP Sciences] [Google Scholar]
- Catalano, A., Benoit, A., Bourrion, O., et al. 2016, A&A, 592, A26 [NASA ADS] [CrossRef] [EDP Sciences] [Google Scholar]
- Cordes, J. M., & Chatterjee, S. 2019, ARA&A, 57, 417 [NASA ADS] [CrossRef] [Google Scholar]
- Cromartie, H. T., Fonseca, E., Ransom, S. M., et al. 2020, Nat. Astron., 4, 72 [NASA ADS] [CrossRef] [Google Scholar]
- Dai, S., Lower, M. E., Bailes, M., et al. 2019, ApJ, 874, L14 [CrossRef] [Google Scholar]
- Eatough, R. P., Falcke, H., Karuppusamy, R., et al. 2013, Nature, 501, 391 [NASA ADS] [CrossRef] [PubMed] [Google Scholar]
- Fasano, A., Aguiar, M., Benoit, A., et al. 2020, J. Low Temp. Phys., 199, 529 [NASA ADS] [CrossRef] [Google Scholar]
- Foreman-Mackey, D., Conley, A., Meierjurgen Farr, W., et al. 2013, Astrophysics Source Code Library [record ascl:1303.002] [Google Scholar]
- Gotthelf, E. V., Halpern, J. P., Alford, J. A. J., et al. 2019, ApJ, 874, L25 [NASA ADS] [CrossRef] [Google Scholar]
- Halpern, J. P., Gotthelf, E. V., Becker, R. H., Helfand, D. J., & White, R. L. 2005, ApJ, 632, L29 [NASA ADS] [CrossRef] [Google Scholar]
- Ibrahim, A. I., Markwardt, C. B., Swank, J. H., et al. 2004, ApJ, 609, L21 [NASA ADS] [CrossRef] [Google Scholar]
- Kaspi, V. M., & Beloborodov, A. M. 2017, ARA&A, 55, 261 [NASA ADS] [CrossRef] [Google Scholar]
- Kramer, M., Stairs, I. H., Manchester, R. N., et al. 2006, Science, 314, 97 [NASA ADS] [CrossRef] [PubMed] [Google Scholar]
- Lazaridis, K., Jessner, A., Kramer, M., et al. 2008, MNRAS, 390, 839 [NASA ADS] [CrossRef] [Google Scholar]
- Levin, L., Bailes, M., Bates, S., et al. 2010, ApJ, 721, L33 [NASA ADS] [CrossRef] [Google Scholar]
- Levin, L., Lyne, A. G., Desvignes, G., et al. 2019, MNRAS, 488, 5251 [NASA ADS] [CrossRef] [Google Scholar]
- Liu, K., Young, A., Wharton, R., et al. 2019, ApJ, 885, L10 [CrossRef] [Google Scholar]
- Lorimer, D. R., & Kramer, M. 2005, Handbook of Pulsar Astronomy (Cambridge: Cambridge University Press) [Google Scholar]
- Maan, Y., Joshi, B. C., Surnis, M. P., Bagchi, M., & Manoharan, P. K. 2019, ApJ, 882, L9 [NASA ADS] [CrossRef] [Google Scholar]
- Manchester, R. N., Hobbs, G. B., Teoh, A., & Hobbs, M. 2005, AJ, 129, 1993 [NASA ADS] [CrossRef] [Google Scholar]
- Maron, O., Kijak, J., Kramer, M., & Wielebinski, R. 2000, A&AS, 147, 195 [NASA ADS] [CrossRef] [EDP Sciences] [Google Scholar]
- Mauskopf, P. D. 2018, PASP, 130, 082001 [CrossRef] [Google Scholar]
- Mazin, B. A., Meeker, S. R., Strader, M. J., et al. 2013, PASP, 125, 1348 [NASA ADS] [CrossRef] [Google Scholar]
- Melrose, D. B. 2017, Rev. Mod. Plasma Phys., 1, 5 [CrossRef] [Google Scholar]
- Michel, F. C. 1978, ApJ, 220, 1101 [NASA ADS] [CrossRef] [Google Scholar]
- Minter, A. H., Camilo, F., Ransom, S. M., Halpern, J. P., & Zimmerman, N. 2008, ApJ, 676, 1189 [CrossRef] [Google Scholar]
- Monfardini, A., Benoit, A., Bideaud, A., et al. 2011, ApJS, 194, 24 [NASA ADS] [CrossRef] [Google Scholar]
- Monfardini, A., Baselmans, J., Benoit, A., et al. 2016, in Lumped Element Kinetic Inductance Detectors for Space Applications, SPIE Conf. Ser., 9914, 99140N [Google Scholar]
- Morris, D., Kramer, M., Thum, C., et al. 1997, A&A, 322, L17 [NASA ADS] [Google Scholar]
- Perotto, L., Ponthieu, N., Macías-Pérez, J. F., et al. 2020, A&A, 637, A71 [CrossRef] [EDP Sciences] [Google Scholar]
- Ritacco, A., Adam, R., Ade, P., et al. 2020, mm Universe @ NIKA2 - Observing the mm Universe with the NIKA2 Camera, Eur. Phys. J. Web Conf., 228, 0002 [Google Scholar]
- Singal, A. K. 2009, ApJ, 703, L109 [NASA ADS] [CrossRef] [Google Scholar]
- Swenson, L. J., Cruciani, A., Benoit, A., et al. 2010, Appl. Phys. Lett., 96, 263511 [NASA ADS] [CrossRef] [Google Scholar]
- Torne, P. 2017, Ph.D. Thesis, University of Bonn [Google Scholar]
- Torne, P., Desvignes, G., Eatough, R. P., et al. 2017, MNRAS, 465, 242 [NASA ADS] [CrossRef] [Google Scholar]
- Torne, P., Eatough, R. P., Karuppusamy, R., et al. 2015, MNRAS, 451, L50 [NASA ADS] [CrossRef] [Google Scholar]
All Tables
All Figures
|
Fig. 1. Average profiles (shown twice for clarity) of the detection of XTE J1810−197 with NIKA2 at 150 GHz (left) and 260 GHz (right). Profiles have 128 bins, corresponding to a time resolution of ≈43 ms on the horizontal axis. Bottom panels: signal intensity over time with 1.7 min resolution on the vertical axis. The white gap corresponds to the time when the telescope did not observe the source. |
| In the text | |
|
Fig. 2. Single-pulse activity from XTE J1810−197 during our observations with NIKA2 on 2019 March 25. Only the last 10 min of the observation at 150 GHz are shown for clarity, but the activity is similar for the total 50 min on-source. No single pulses are detected at 260 GHz, which may be an effect of spectral index and instrumental sensitivity. Upper panels: zoom (1.25 s around the peak) into a selection of six pulses, and they share the y-axis scale in Jansky units. Bottom panel: 10 min time series. The time resolution in all panels is ≈42 ms, limited by the sampling frequency set for the KID arrays. Many pulses show structure. Most pulses are unresolved. |
| In the text | |
|
Fig. 3. Emission spectrum in the millimetre band of the radio magnetar XTE J1810−197 during the observations with NIKA2 on 2019 March 25. The solid black line indicates the mean value, and the shaded blue region encompasses the 68% confidence interval. The spectral index is α = −1.1 ± 0.3 (for Sν ∝ να). |
| In the text | |
Current usage metrics show cumulative count of Article Views (full-text article views including HTML views, PDF and ePub downloads, according to the available data) and Abstracts Views on Vision4Press platform.
Data correspond to usage on the plateform after 2015. The current usage metrics is available 48-96 hours after online publication and is updated daily on week days.
Initial download of the metrics may take a while.