Fig. 4
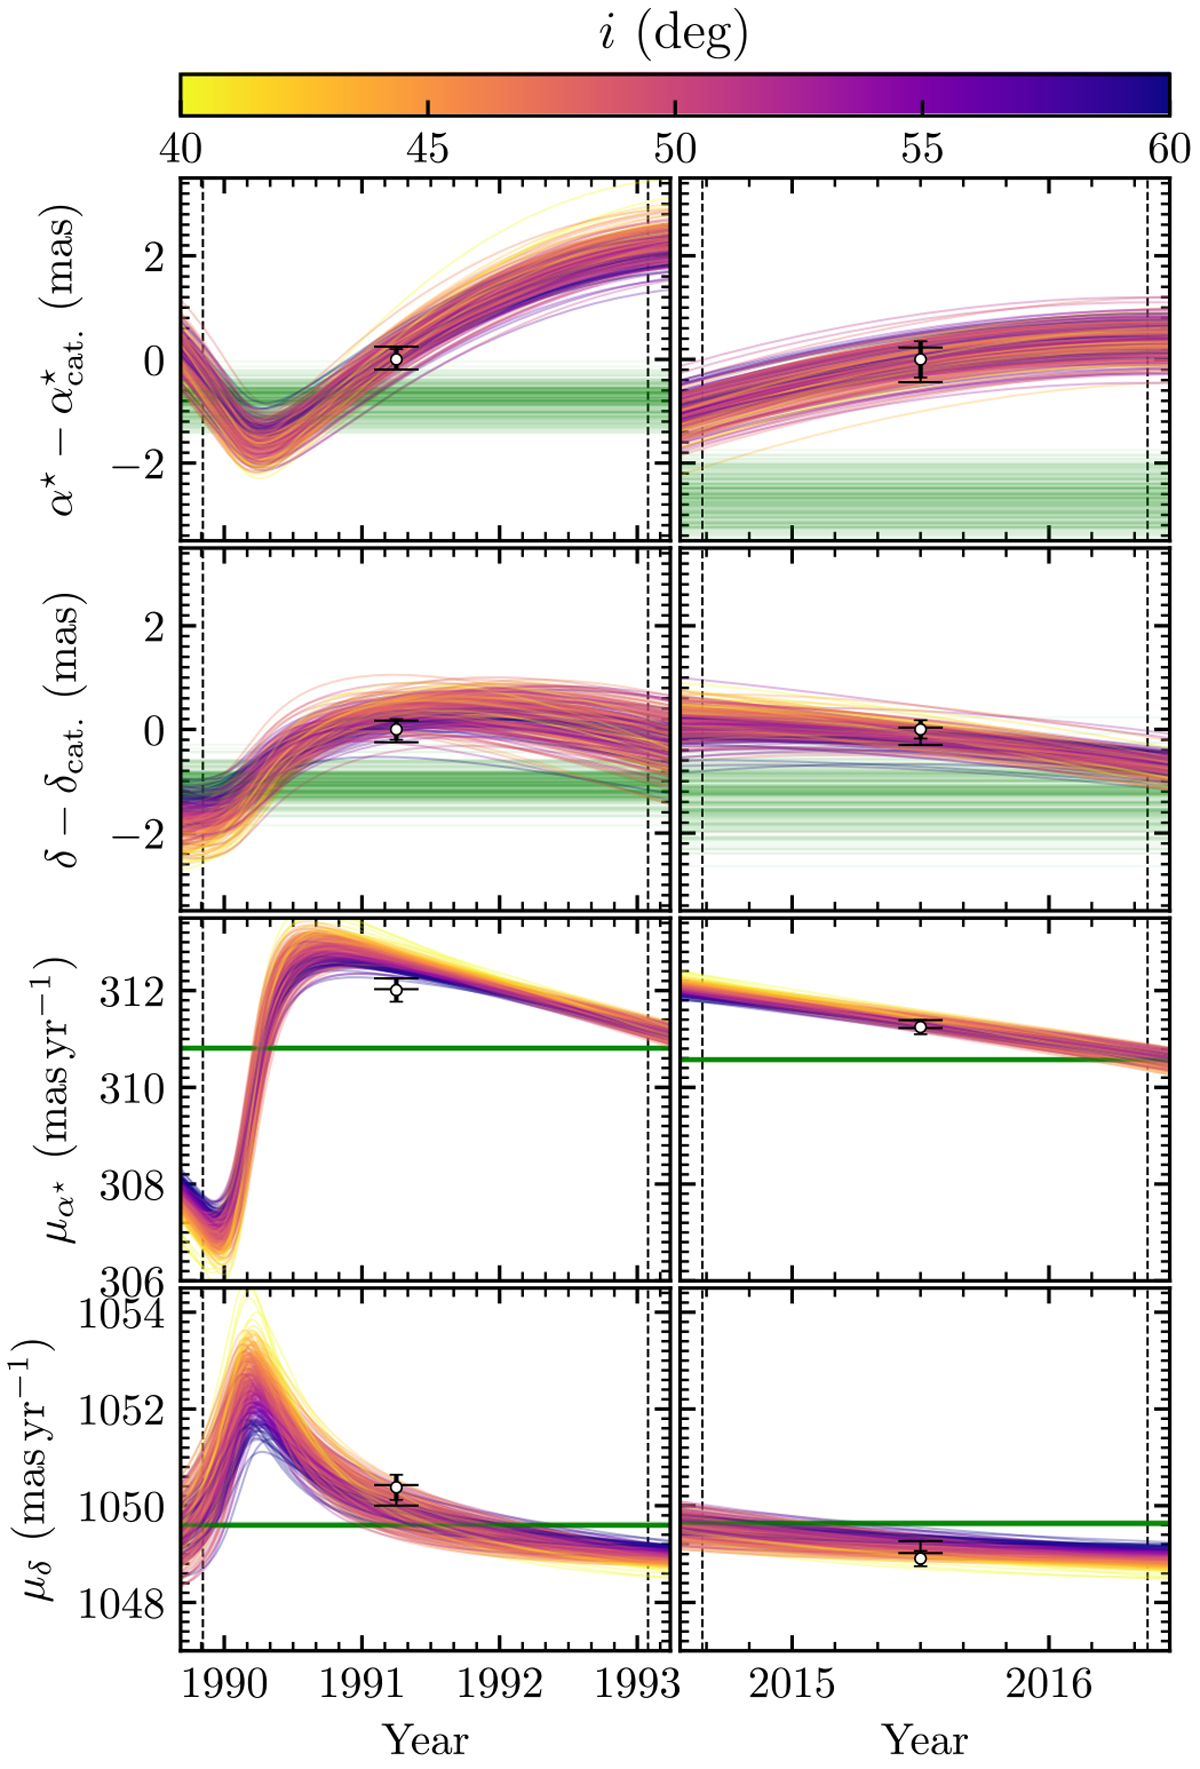
Position (top two panels) and proper motion (bottom two panels) of the photocenter during time span of the HIPPARCOS and Gaia measurements used in this study from the fit using all available astrometric data. For the position plots the proper motion of the barycenter was subtracted, and the positions are relative to the catalog values. The position of the barycenter relative to the catalog value and its proper motion are also plotted (horizontal green lines). The significant change in the proper motion of the barycenter in the α⋆ direction is due to the southern declination of the star. catalog values are plotted as the circle with thick error bars. Simulated measurements based on a five-parameter fit to the combined motion of the photocenter and barycenter are shown by the more extended error bars.
Current usage metrics show cumulative count of Article Views (full-text article views including HTML views, PDF and ePub downloads, according to the available data) and Abstracts Views on Vision4Press platform.
Data correspond to usage on the plateform after 2015. The current usage metrics is available 48-96 hours after online publication and is updated daily on week days.
Initial download of the metrics may take a while.