Fig. 3
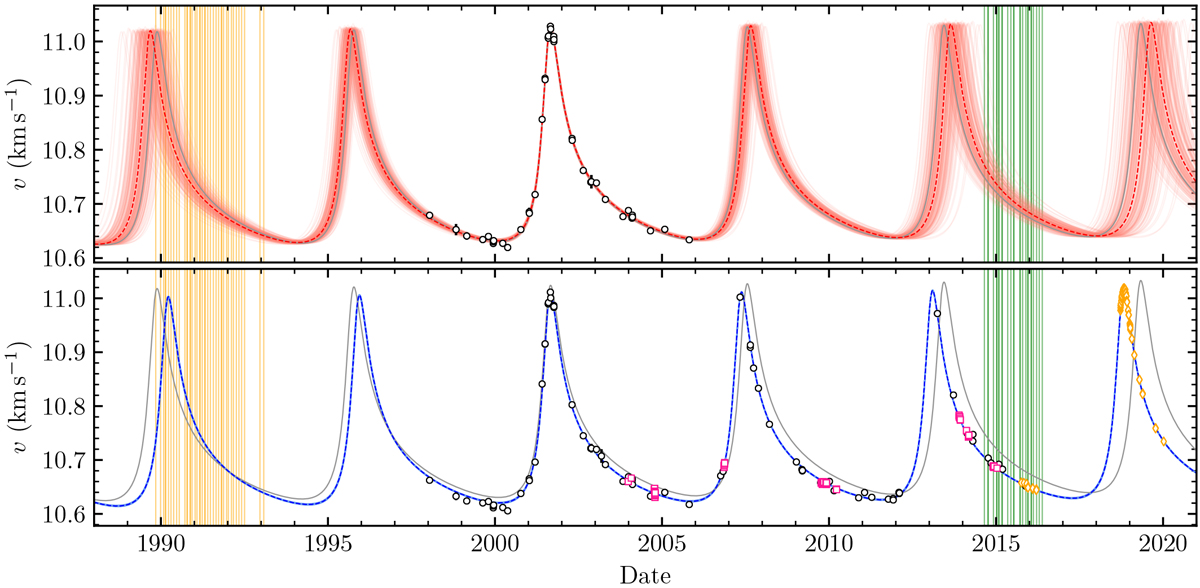
Spectroscopic orbit of the star π Men aroundthe system barycenter using the radial velocity record presented in Butler et al. (2006; top panel) and this work (bottom panel). Measurements are plotted from UCLES (black circles), HARPS1 (pre-upgrade, pink squares), and HARPS2 (post-upgrade; yellow diamonds). The maximum likelihood orbit is plotted as a dashed line, with draws from an MCMC fit shown as light solid lines. The orbit is now so well constrained that the uncertainty of the predicted radial velocity at any given epoch is smaller than the thickness of the dashed line. In both panels the best fit orbit computed by Butler et al. (2006) and used by Reffert & Quirrenbach (2011) is shown as a solid gray curve. Dates of the individual HIPPARCOS and Gaia measurements are denoted by orange and green vertical lines, respectively.
Current usage metrics show cumulative count of Article Views (full-text article views including HTML views, PDF and ePub downloads, according to the available data) and Abstracts Views on Vision4Press platform.
Data correspond to usage on the plateform after 2015. The current usage metrics is available 48-96 hours after online publication and is updated daily on week days.
Initial download of the metrics may take a while.