Fig. 2
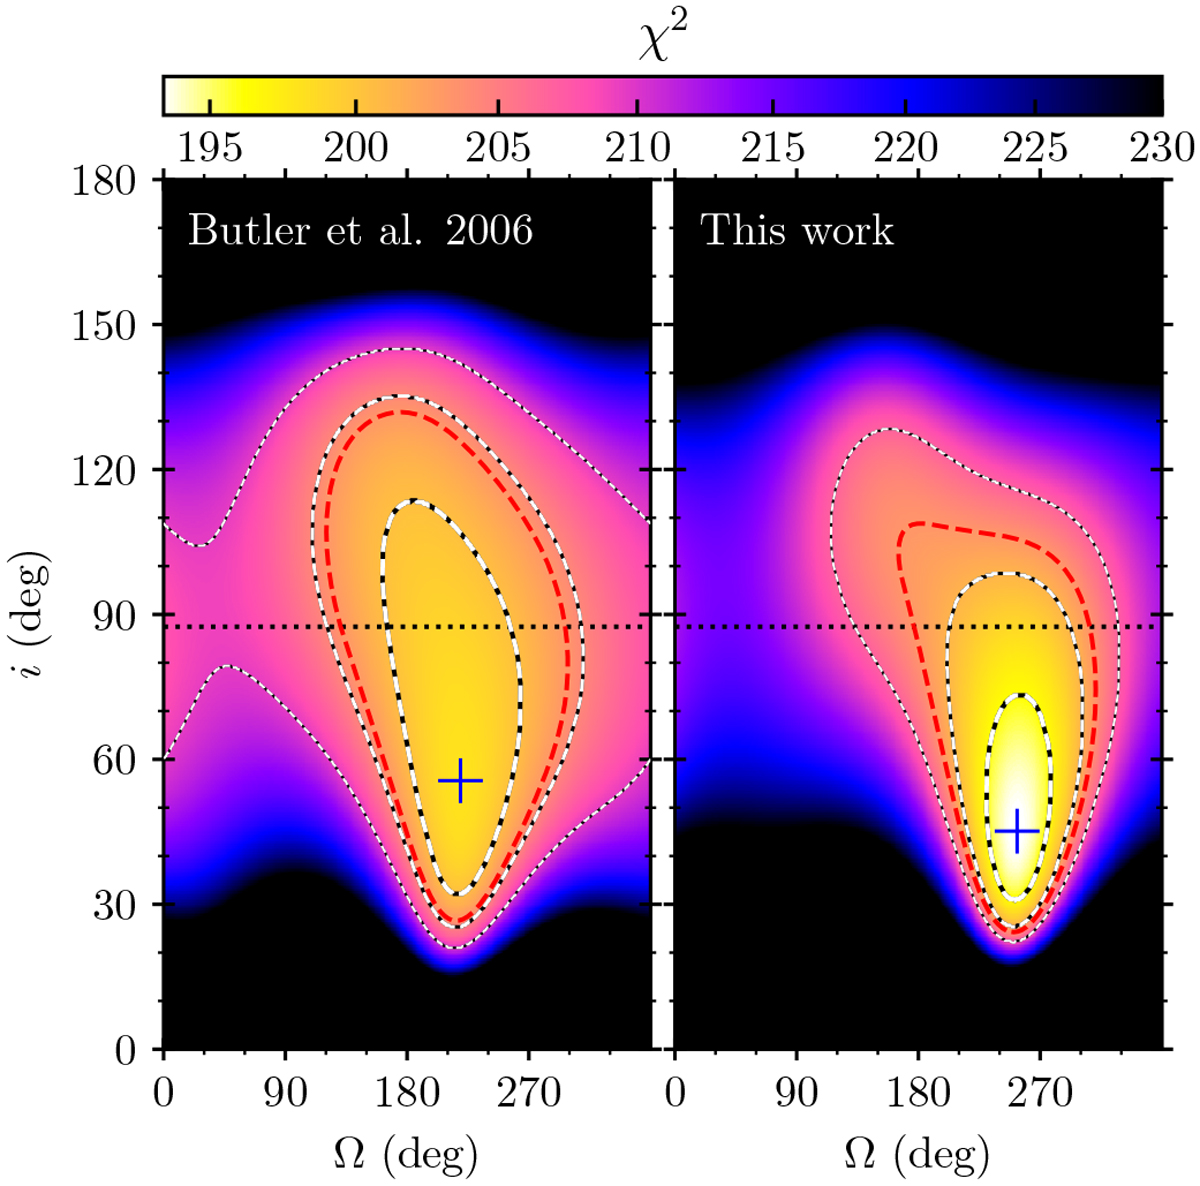
Goodness of fit (χ2) as a functionof the inclination i and the position angle of the ascending node Ω for the photocenter orbit of the π Men system using the spectroscopic orbit from Butler et al. (2006; left), and the revised orbit presented in Table 2 (right). Dashed lines (black and white) denote areas enclosing 68, 95, and 99.7% of the probability. The value of
![]() calculated using an unperturbed five-parameter fit is also plotted (red dashed line). The lowest
χ2 is indicated by the cross, and the inclination of π
Men c from Huang et al. (2018) is plotted for reference (horizontal dashed line).
calculated using an unperturbed five-parameter fit is also plotted (red dashed line). The lowest
χ2 is indicated by the cross, and the inclination of π
Men c from Huang et al. (2018) is plotted for reference (horizontal dashed line).
Current usage metrics show cumulative count of Article Views (full-text article views including HTML views, PDF and ePub downloads, according to the available data) and Abstracts Views on Vision4Press platform.
Data correspond to usage on the plateform after 2015. The current usage metrics is available 48-96 hours after online publication and is updated daily on week days.
Initial download of the metrics may take a while.