Fig. 2.
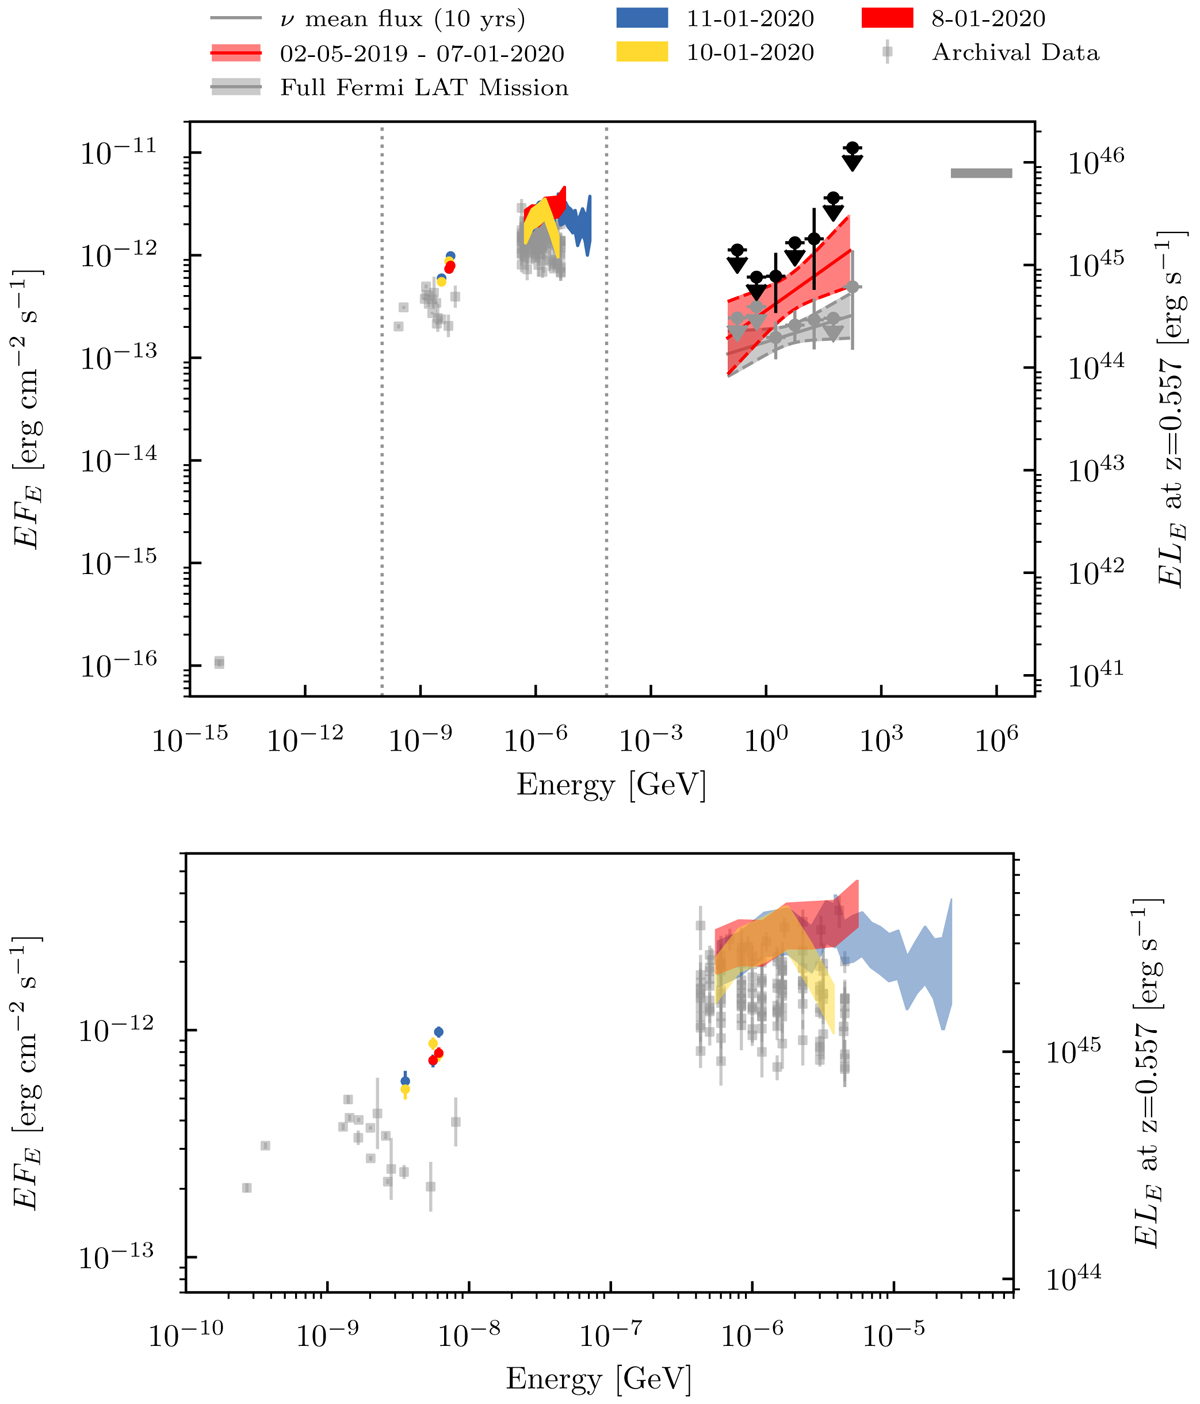
3HSP J095507.1+355101 SED. The grey points refer to archival data and, in the case of Fermi-LAT data, the time-integrated measurement up to the neutrino arrival alert. The average all-flavour neutrino flux is shown for an assumed live time of 10 yr. Coloured data points are Swift and NuSTAR measurements made around the neutrino arrival time. The black/grey γ-ray points refer to the red/grey bow ties, indicating the one-sigma uncertainty of the γ-ray measurement 250 days before the observation of IceCube-200107A and during the full mission, respectively. The best-fit fluxes are shown as solid lines. Upper panel: full hybrid SED, while lower panel: enlarged view of the optical and X-ray bands.
Current usage metrics show cumulative count of Article Views (full-text article views including HTML views, PDF and ePub downloads, according to the available data) and Abstracts Views on Vision4Press platform.
Data correspond to usage on the plateform after 2015. The current usage metrics is available 48-96 hours after online publication and is updated daily on week days.
Initial download of the metrics may take a while.