Fig. 9.
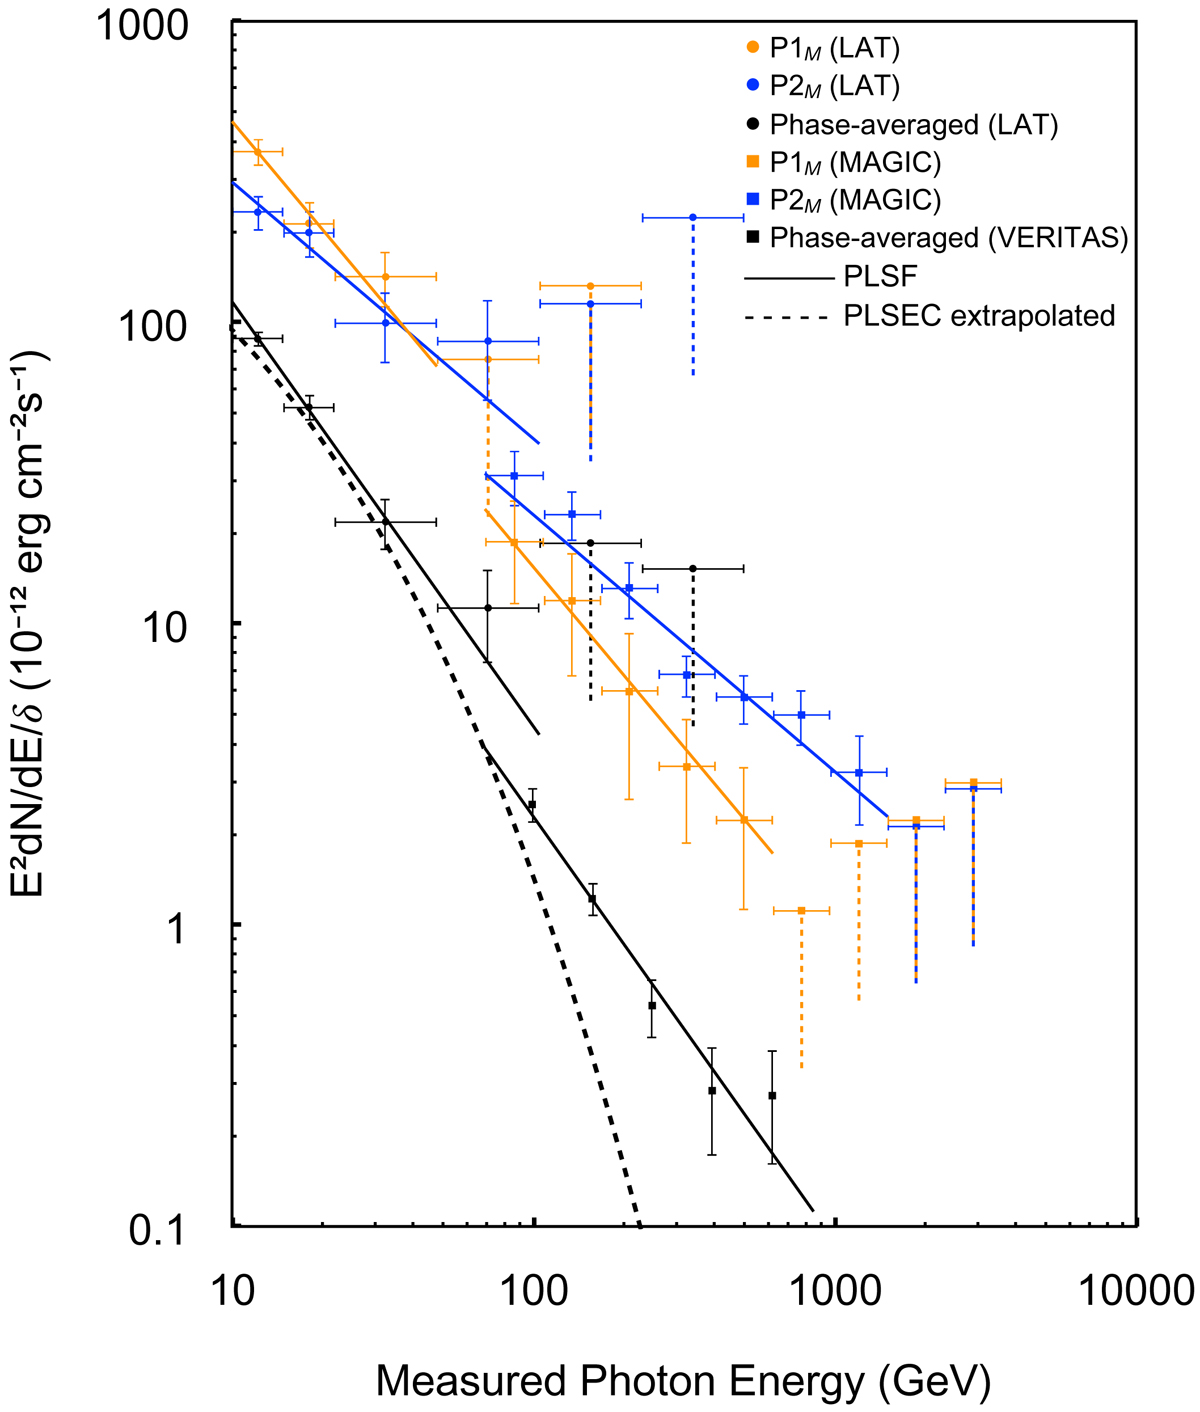
> 10 GeV SEDs of the Crab pulsar at different pulse phases observed with LAT and ground-based instruments. The vertical axis shows the differential flux per unit phase (δ). The horizontal axis shows the measured photon energy (unscaled). Be noted that the orange/blue LAT bins presented here are different from those presented in Fig. 4 because the phase ranges are adjusted for comparison purpose. For each phase we investigate, we overlay the spectrum predicted by the joint-instrument fit of PLSF. The PLSEC fit to the broadband LAT spectrum in the full phase (Fig. 3) and its extrapolation are also overlaid for comparison.
Current usage metrics show cumulative count of Article Views (full-text article views including HTML views, PDF and ePub downloads, according to the available data) and Abstracts Views on Vision4Press platform.
Data correspond to usage on the plateform after 2015. The current usage metrics is available 48-96 hours after online publication and is updated daily on week days.
Initial download of the metrics may take a while.