Fig. 8.
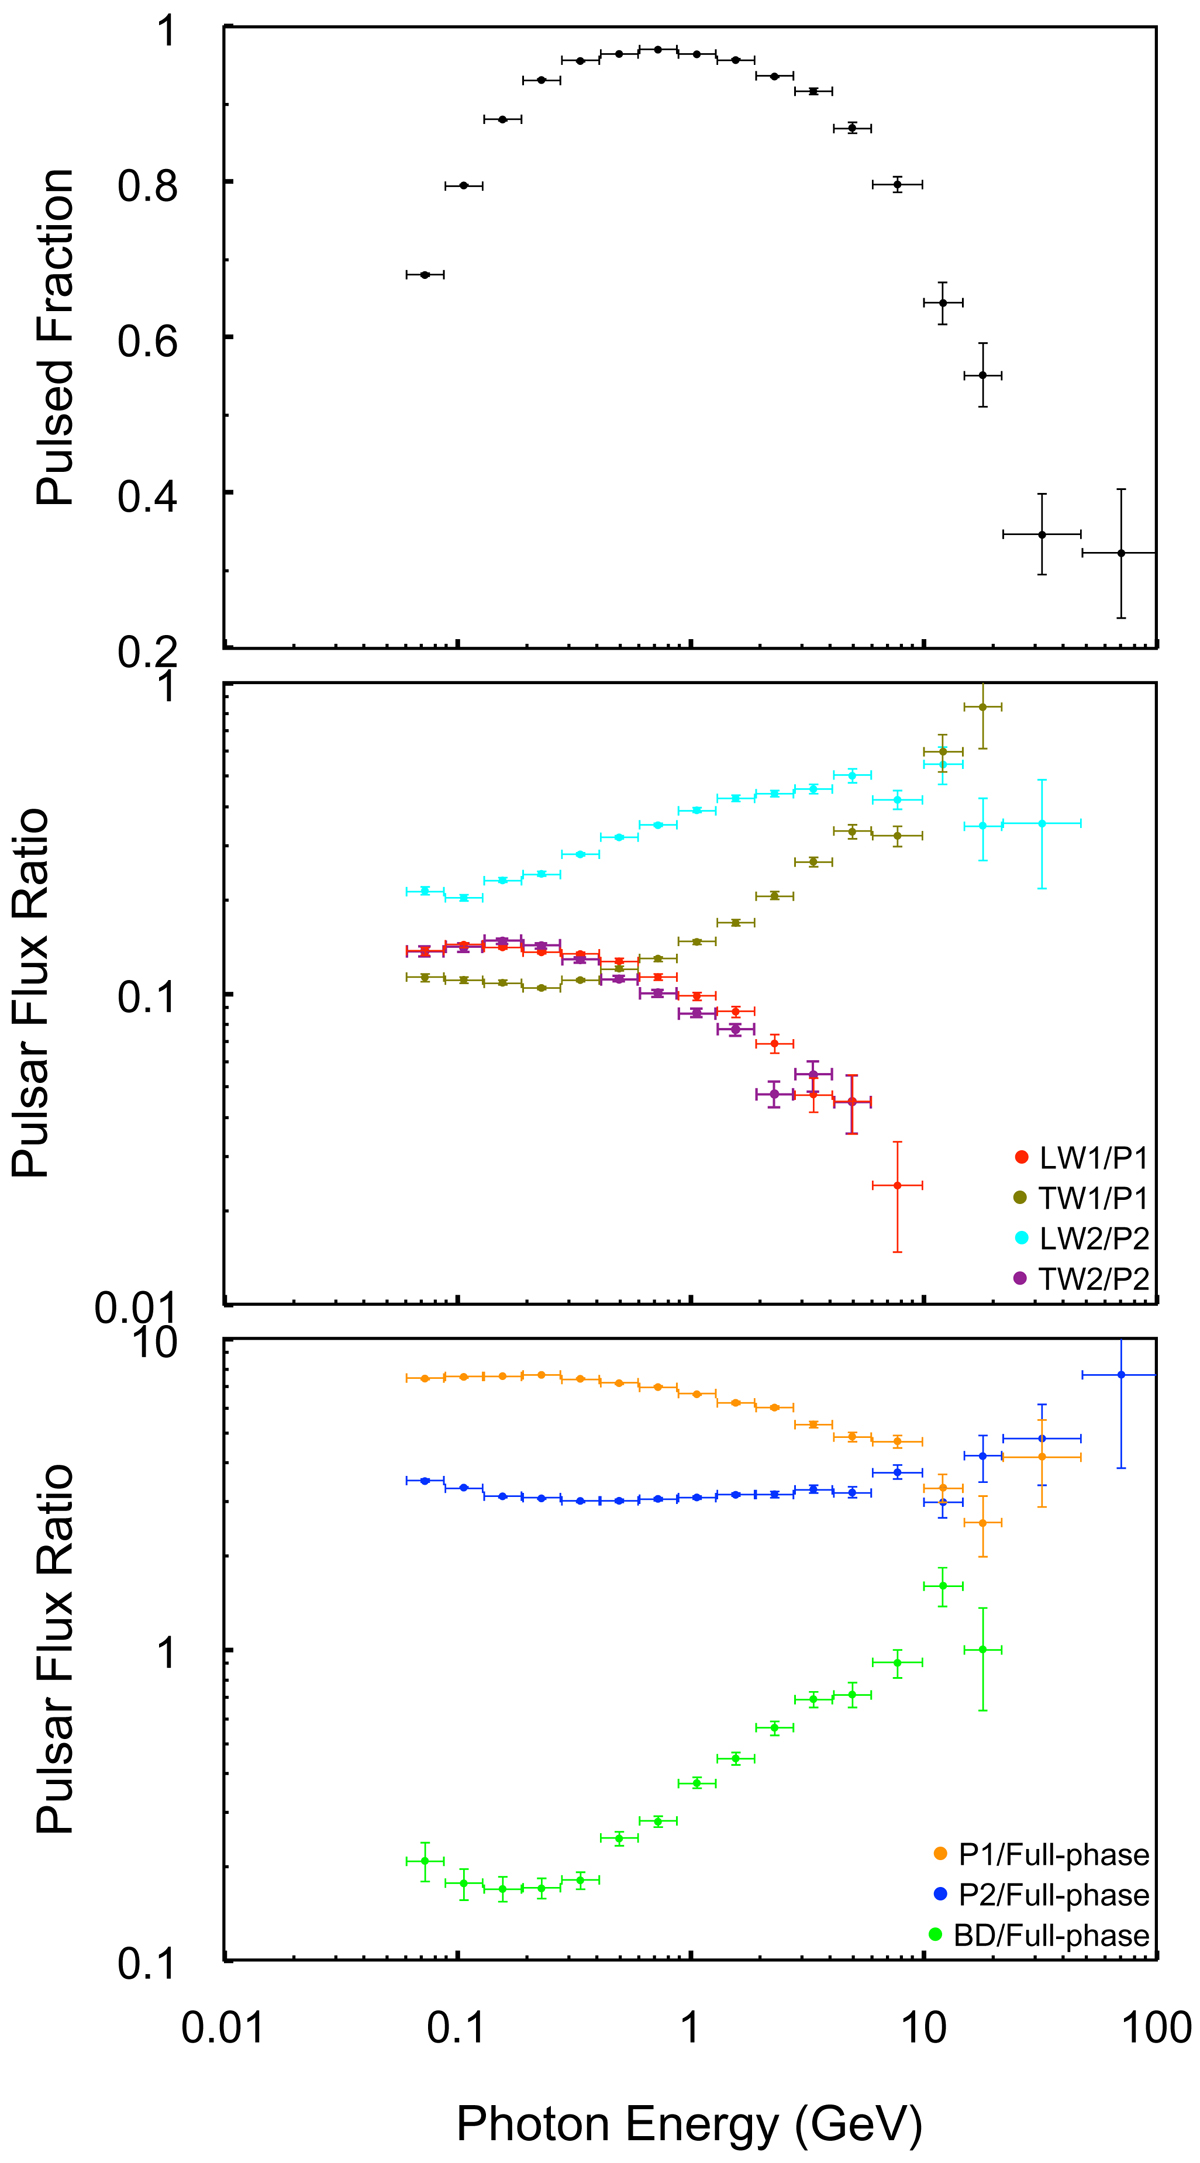
Top: pulsed fraction of the entire Crab pulsar/nebula complex. Middle and bottom: flux ratios of the Crab pulsar between different pairs of phases in different energy bins. We recall that each flux has been scaled by the inverse of the phase interval.
Current usage metrics show cumulative count of Article Views (full-text article views including HTML views, PDF and ePub downloads, according to the available data) and Abstracts Views on Vision4Press platform.
Data correspond to usage on the plateform after 2015. The current usage metrics is available 48-96 hours after online publication and is updated daily on week days.
Initial download of the metrics may take a while.