Fig. 7.
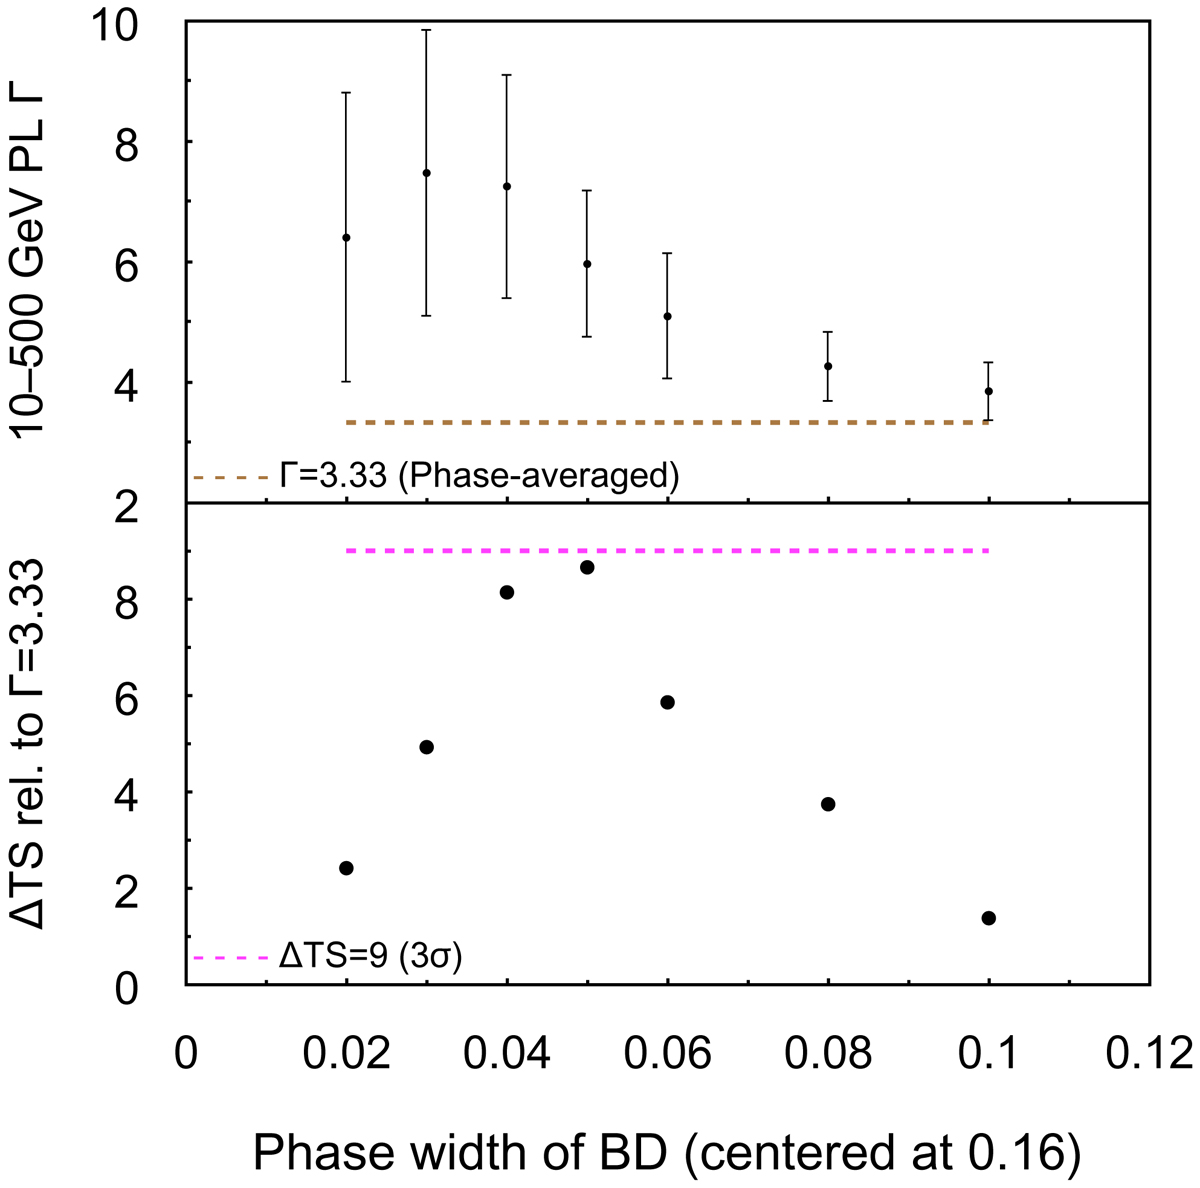
Top: evolution of the 10–500 GeV PL index Γ with adjustments to the phase width of BD. Bottom: corresponding TS differences between fixing Γ at the phase-averaged value of 3.33 and leaving it free. Each of their square roots is the significance at which the local spectrum for an adjusted phase interval of BD is softer than the phase-averaged spectrum.
Current usage metrics show cumulative count of Article Views (full-text article views including HTML views, PDF and ePub downloads, according to the available data) and Abstracts Views on Vision4Press platform.
Data correspond to usage on the plateform after 2015. The current usage metrics is available 48-96 hours after online publication and is updated daily on week days.
Initial download of the metrics may take a while.