Fig. 4.
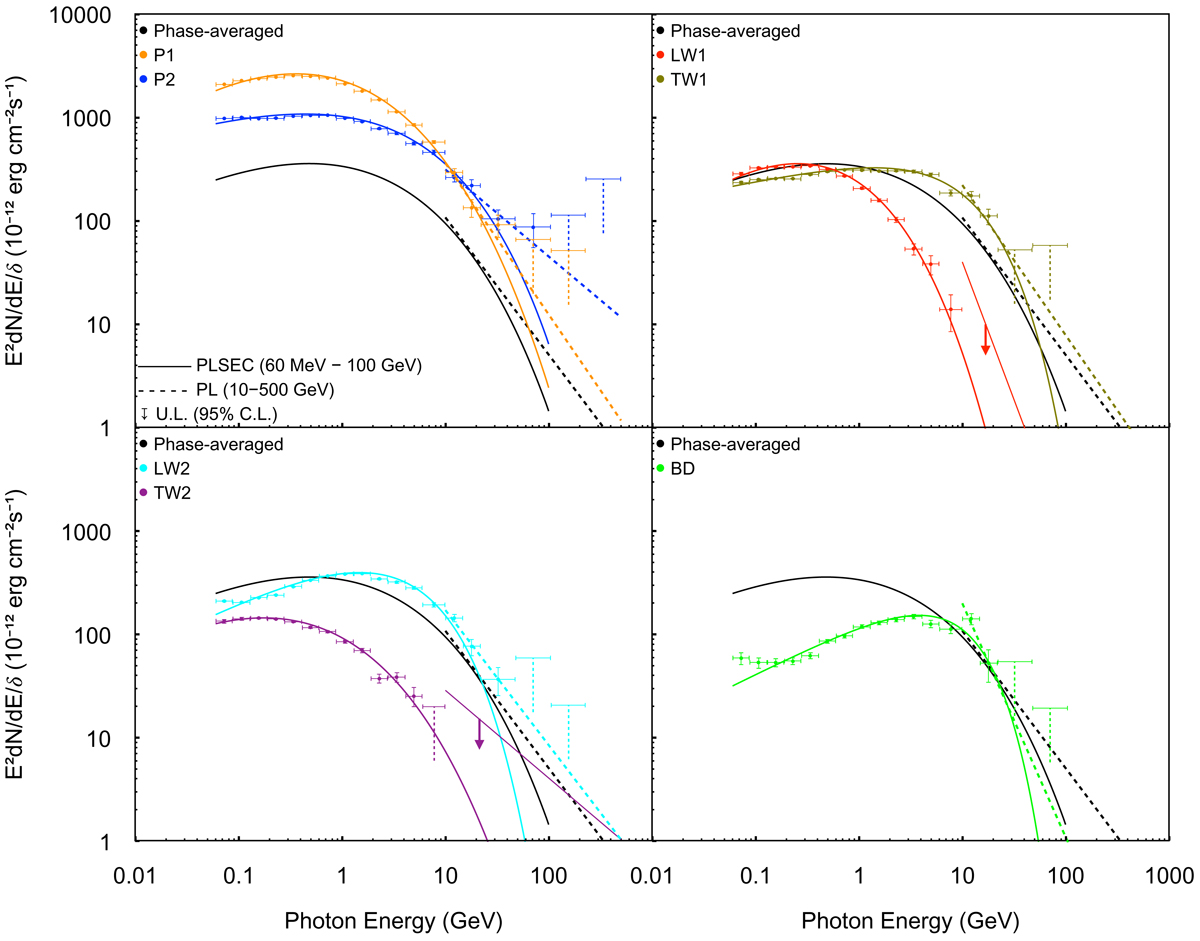
Phase-resolved LAT SEDs of the Crab pulsar. The vertical axis of each panel shows the differential flux per unit phase (δ). All upper limits presented are at a 95% confidence level. For each phase we investigate, we overlay the 60 MeV–100 GeV spectrum predicted by PLSEC and the 10–500 GeV spectrum predicted by PL. The model lines fit to the phase-averaged pulsar spectrum (Fig. 3) are also overlaid on each panel for comparison. Since the Crab pulsar is not significantly detected (< 2σ) above 10 GeV at LW1 and TW2, the upper limits on differential fluxes at these energies and phases are represented by “ad hoc” PL models (the red and purple straight lines appended with arrows), each of which is determined through iterating the prefactor while fixing the index at the maximum-likelihood value.
Current usage metrics show cumulative count of Article Views (full-text article views including HTML views, PDF and ePub downloads, according to the available data) and Abstracts Views on Vision4Press platform.
Data correspond to usage on the plateform after 2015. The current usage metrics is available 48-96 hours after online publication and is updated daily on week days.
Initial download of the metrics may take a while.