Fig. 3.
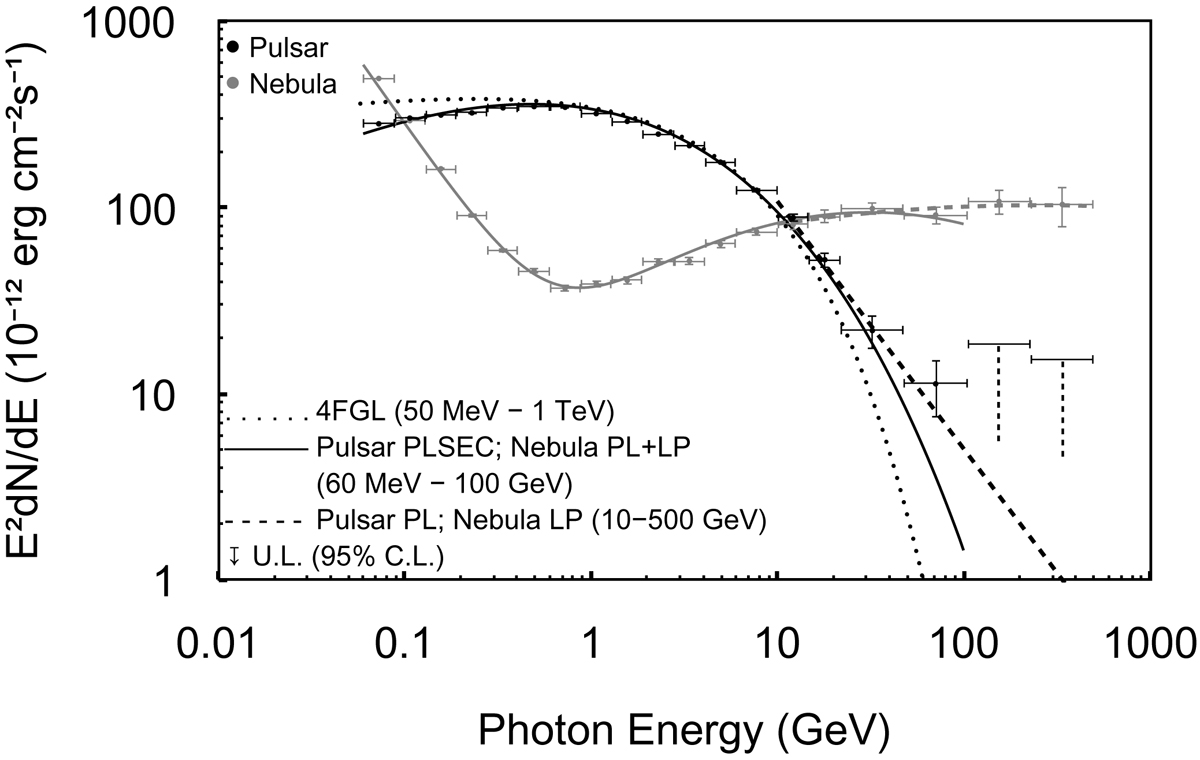
Phase-averaged LAT SEDs of the Crab pulsar and the Crab Nebula. The 4FGL model for the Crab pulsar, reconstructed with fixing λ at 2/3, is overlaid for comparison. All upper limits presented are at a 95% confidence level. We overlay the 60 MeV–100 GeV spectrum predicted by PLSEC and the 10–500 GeV spectrum predicted by PL.
Current usage metrics show cumulative count of Article Views (full-text article views including HTML views, PDF and ePub downloads, according to the available data) and Abstracts Views on Vision4Press platform.
Data correspond to usage on the plateform after 2015. The current usage metrics is available 48-96 hours after online publication and is updated daily on week days.
Initial download of the metrics may take a while.