Fig. 2.
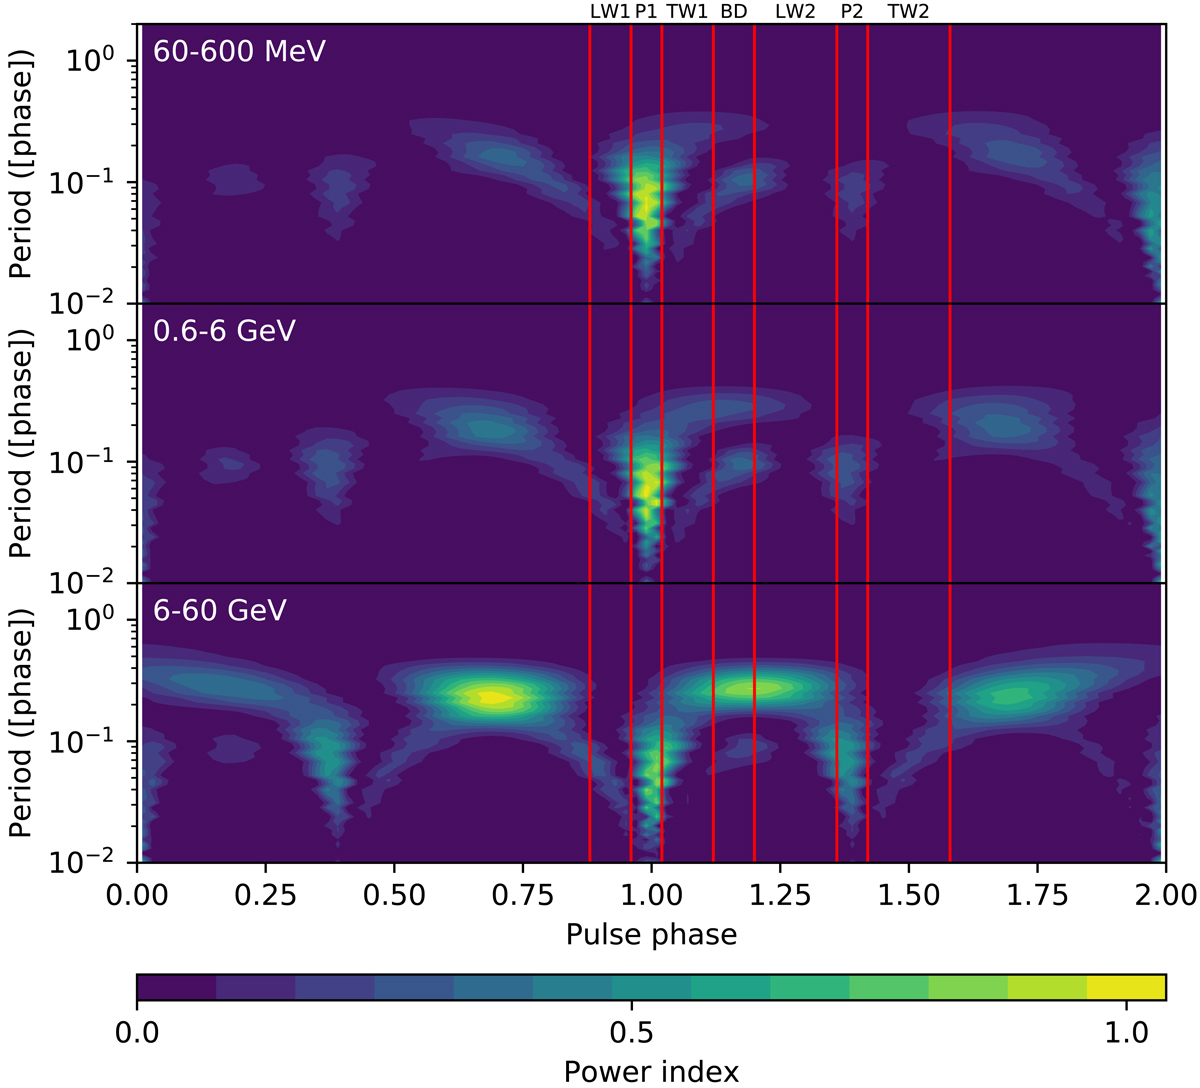
Wavelet maps of the preliminary LAT phaseograms in three exclusive energy bands. A continuous Fourier transform is applied in the period domain for each phaseogram. The Ricker wavelet is adopted. The power index (the colour scale) is defined as the variance per unit period per unit phase divided by the maximum. Each red vertical line is a border between two phase ranges we define.
Current usage metrics show cumulative count of Article Views (full-text article views including HTML views, PDF and ePub downloads, according to the available data) and Abstracts Views on Vision4Press platform.
Data correspond to usage on the plateform after 2015. The current usage metrics is available 48-96 hours after online publication and is updated daily on week days.
Initial download of the metrics may take a while.