Free Access
Fig. 2.
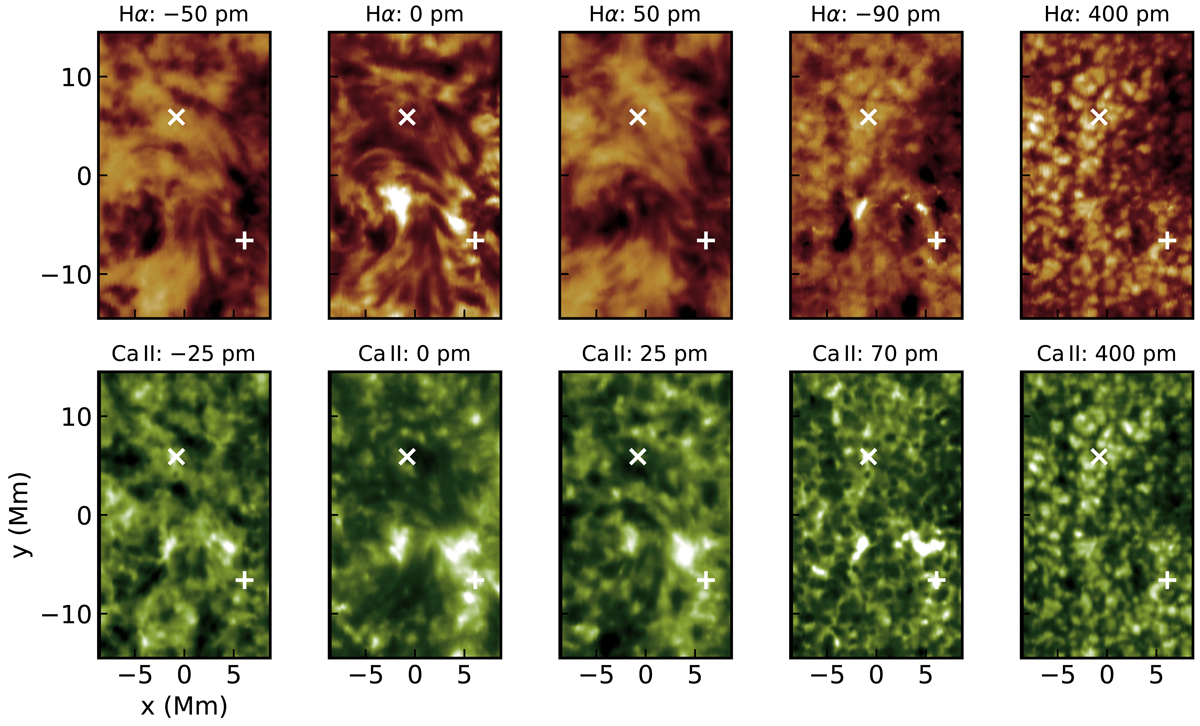
Monochromatic images of a quiet region constructed at ten selected wavelengths. The two symbols mark the position of a intranetwork feature (x) and a network feature (+) selected for the illustration of the observed line profiles and the model fitting.
Current usage metrics show cumulative count of Article Views (full-text article views including HTML views, PDF and ePub downloads, according to the available data) and Abstracts Views on Vision4Press platform.
Data correspond to usage on the plateform after 2015. The current usage metrics is available 48-96 hours after online publication and is updated daily on week days.
Initial download of the metrics may take a while.