Fig. 9.
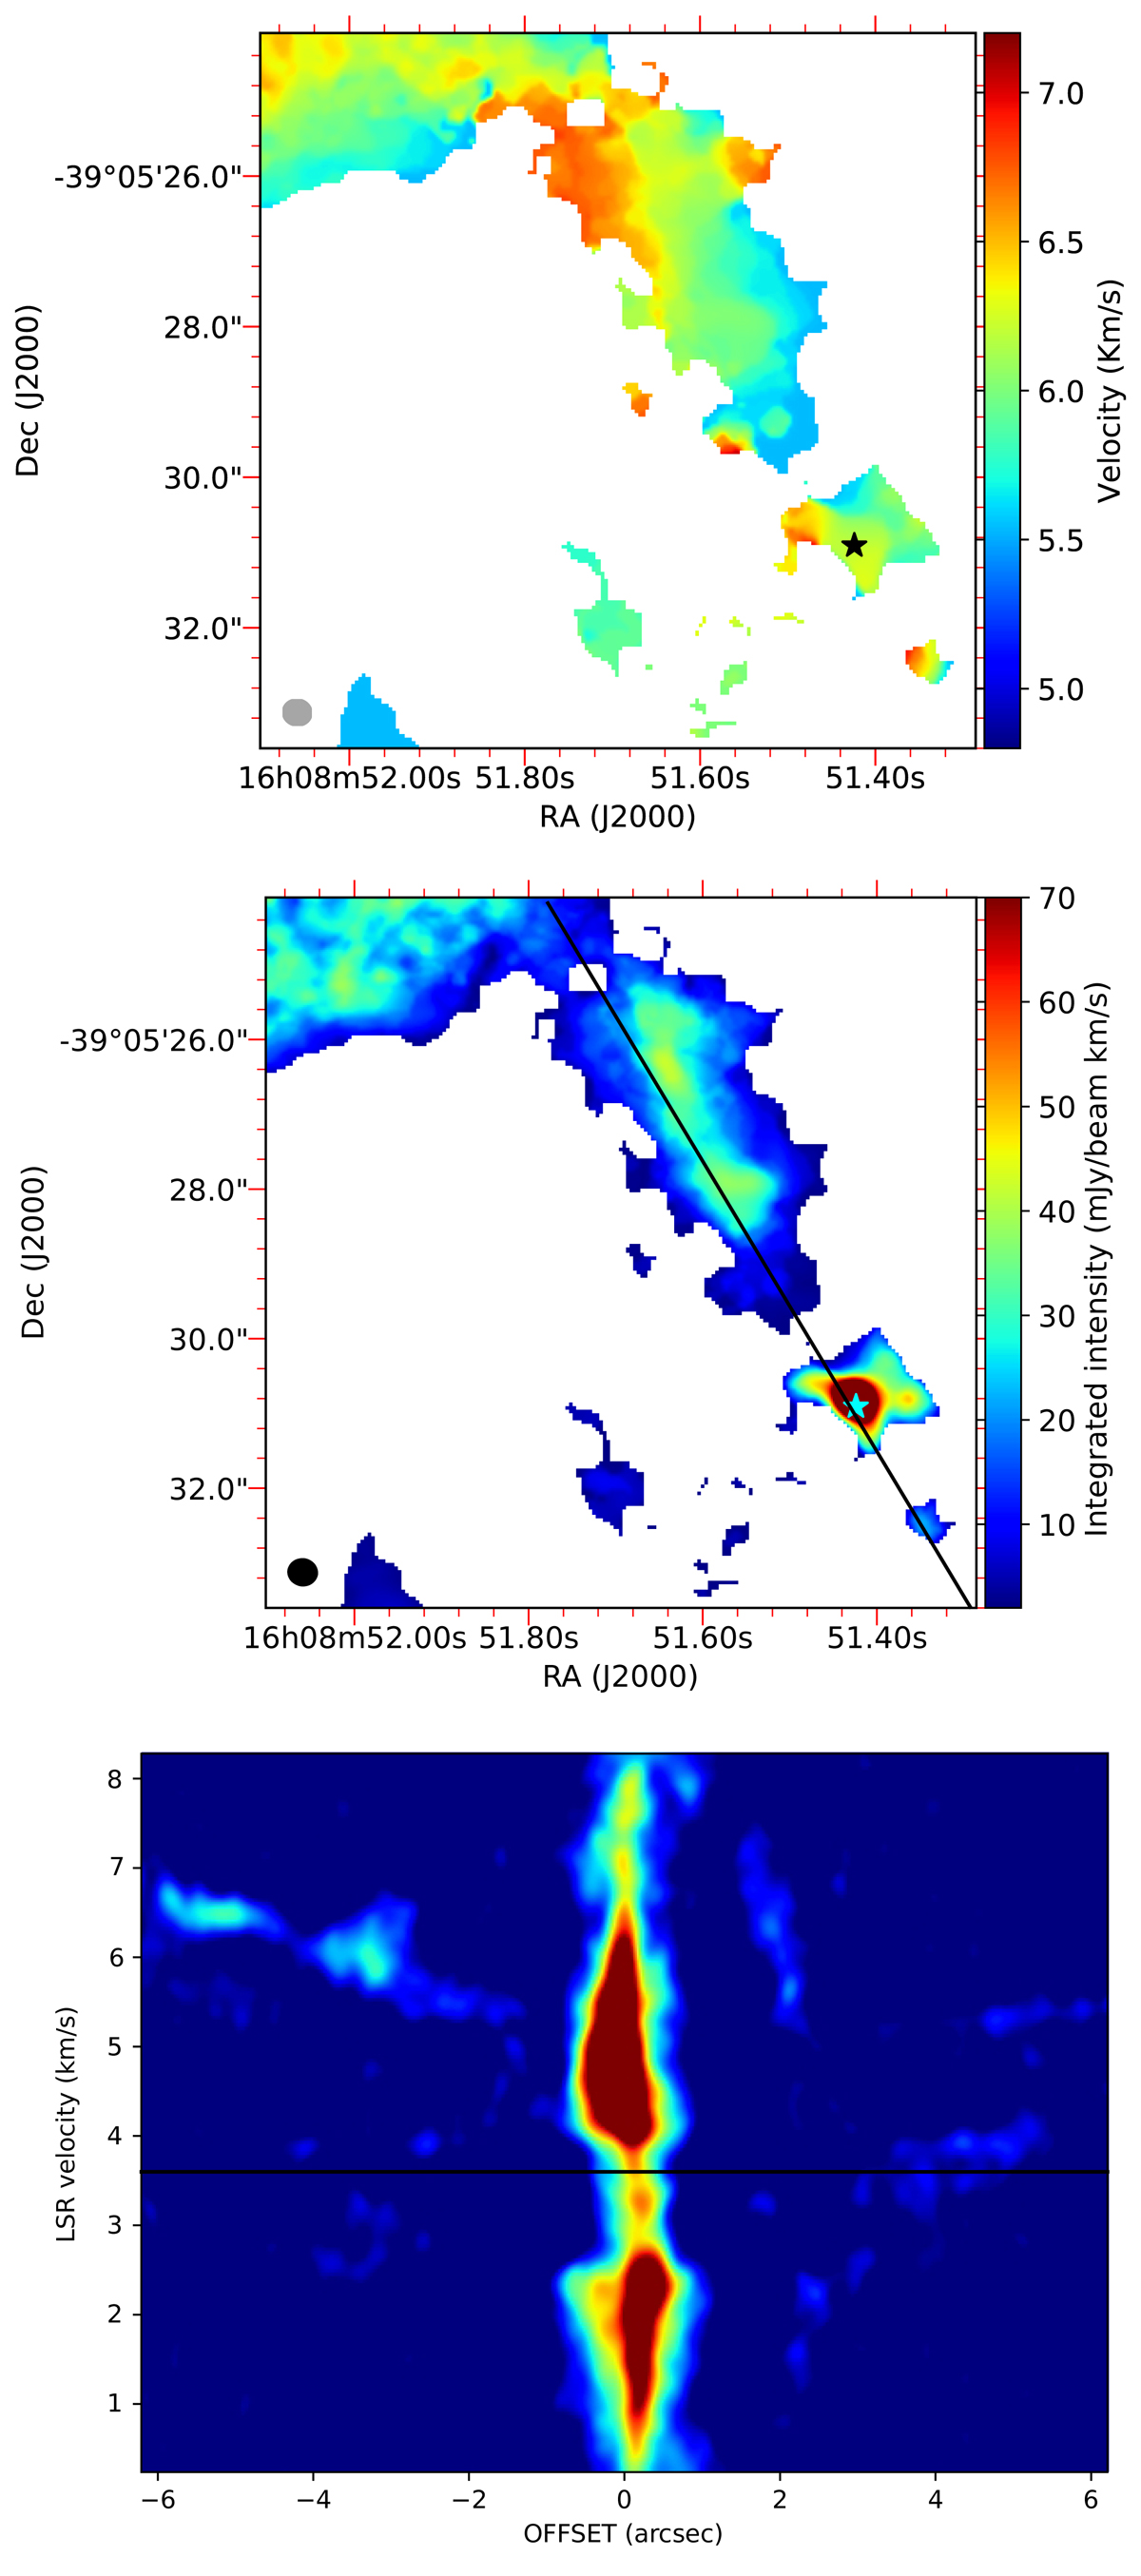
Images of the CO(3–2). Top panel: ALMA velocity map considering an intensity above 5σ. Middle panel: CO(3–2) flux-integrated ALMA map with pixels above 5σ. The black line marks the path for the position-velocity diagram in the bottom panel. Bottom panel: Position-velocity diagram with a PA of 30.5 deg and a width of ∼1.2 arcsec. The horizontal black lines shows the systemic velocity of Par-Lup3-4. The cyan or black star marks the position of the peak intensity in the continuum image. In the two first images the beam size is represented by the gray ellipse in the bottom left corner.
Current usage metrics show cumulative count of Article Views (full-text article views including HTML views, PDF and ePub downloads, according to the available data) and Abstracts Views on Vision4Press platform.
Data correspond to usage on the plateform after 2015. The current usage metrics is available 48-96 hours after online publication and is updated daily on week days.
Initial download of the metrics may take a while.