Fig. 6.
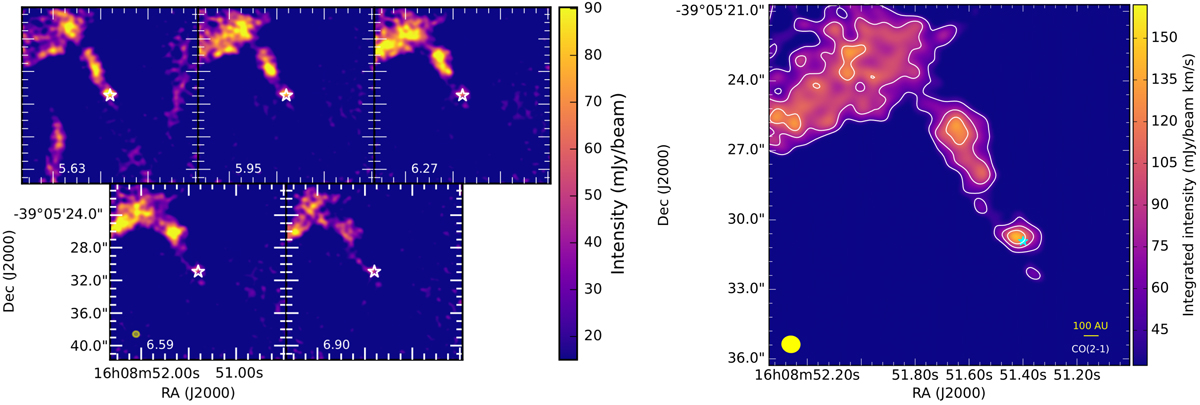
Left panel: CO(2–1) ALMA channel maps toward Par-Lup3-4 and the possible secondary outflow following the northeast direction. All the maps share the same linear color scale with a robust value of 1. Right panel: ALMA-integrated emission of CO(2–1) from a velocity of 5.63–6.90 km s−1. Contours show 3, 5, and 7 times the rms (6.0 × 10⁻³ Jy beam−1). The cyan and white star shows the peak intensity in the continuum source position for all the images. The beam size is represented by a yellow ellipse in the bottom left corner.
Current usage metrics show cumulative count of Article Views (full-text article views including HTML views, PDF and ePub downloads, according to the available data) and Abstracts Views on Vision4Press platform.
Data correspond to usage on the plateform after 2015. The current usage metrics is available 48-96 hours after online publication and is updated daily on week days.
Initial download of the metrics may take a while.