Fig. 5.
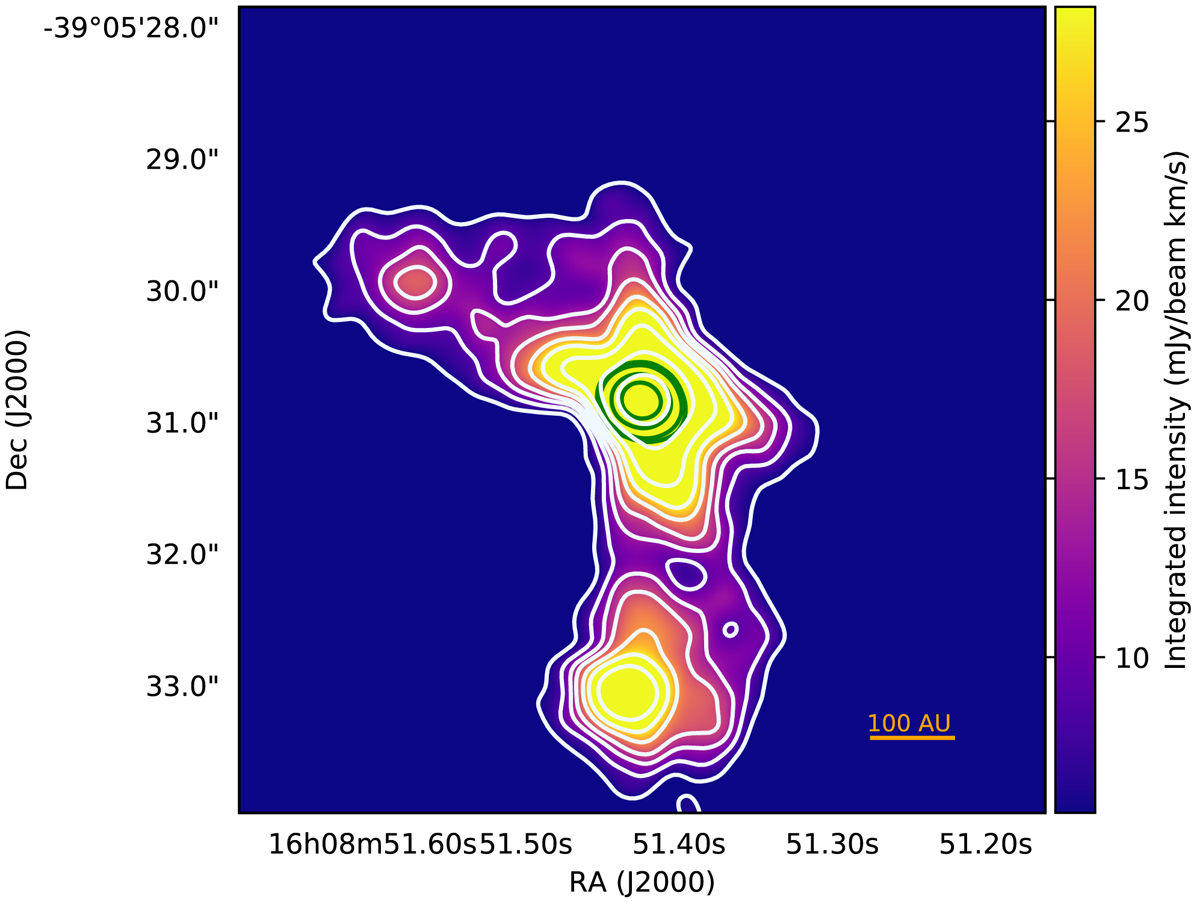
CO(3–2) flux-integrated map in color to show the bipolar molecular outflow cavity. Only channels that show bipolar emission between [−3 km s−1, 2.25 km s−1] and [6.75 km s−1, 10.25 km s−1]) were included. We excluded channels with possible cloud contamination. White contour levels are 3, 5, 7, 9, 12, 15, 20, and 30 times the rms with a robust value of 2. Green contours are the ALMA continuum image at 0.89 mm using 5, 7, 15, and 25 times the rms value with a robust value of 1.5. σ is the rms noise level of the map. Only channels with a bipolar molecular structure were chosen.
Current usage metrics show cumulative count of Article Views (full-text article views including HTML views, PDF and ePub downloads, according to the available data) and Abstracts Views on Vision4Press platform.
Data correspond to usage on the plateform after 2015. The current usage metrics is available 48-96 hours after online publication and is updated daily on week days.
Initial download of the metrics may take a while.