Fig. 2.
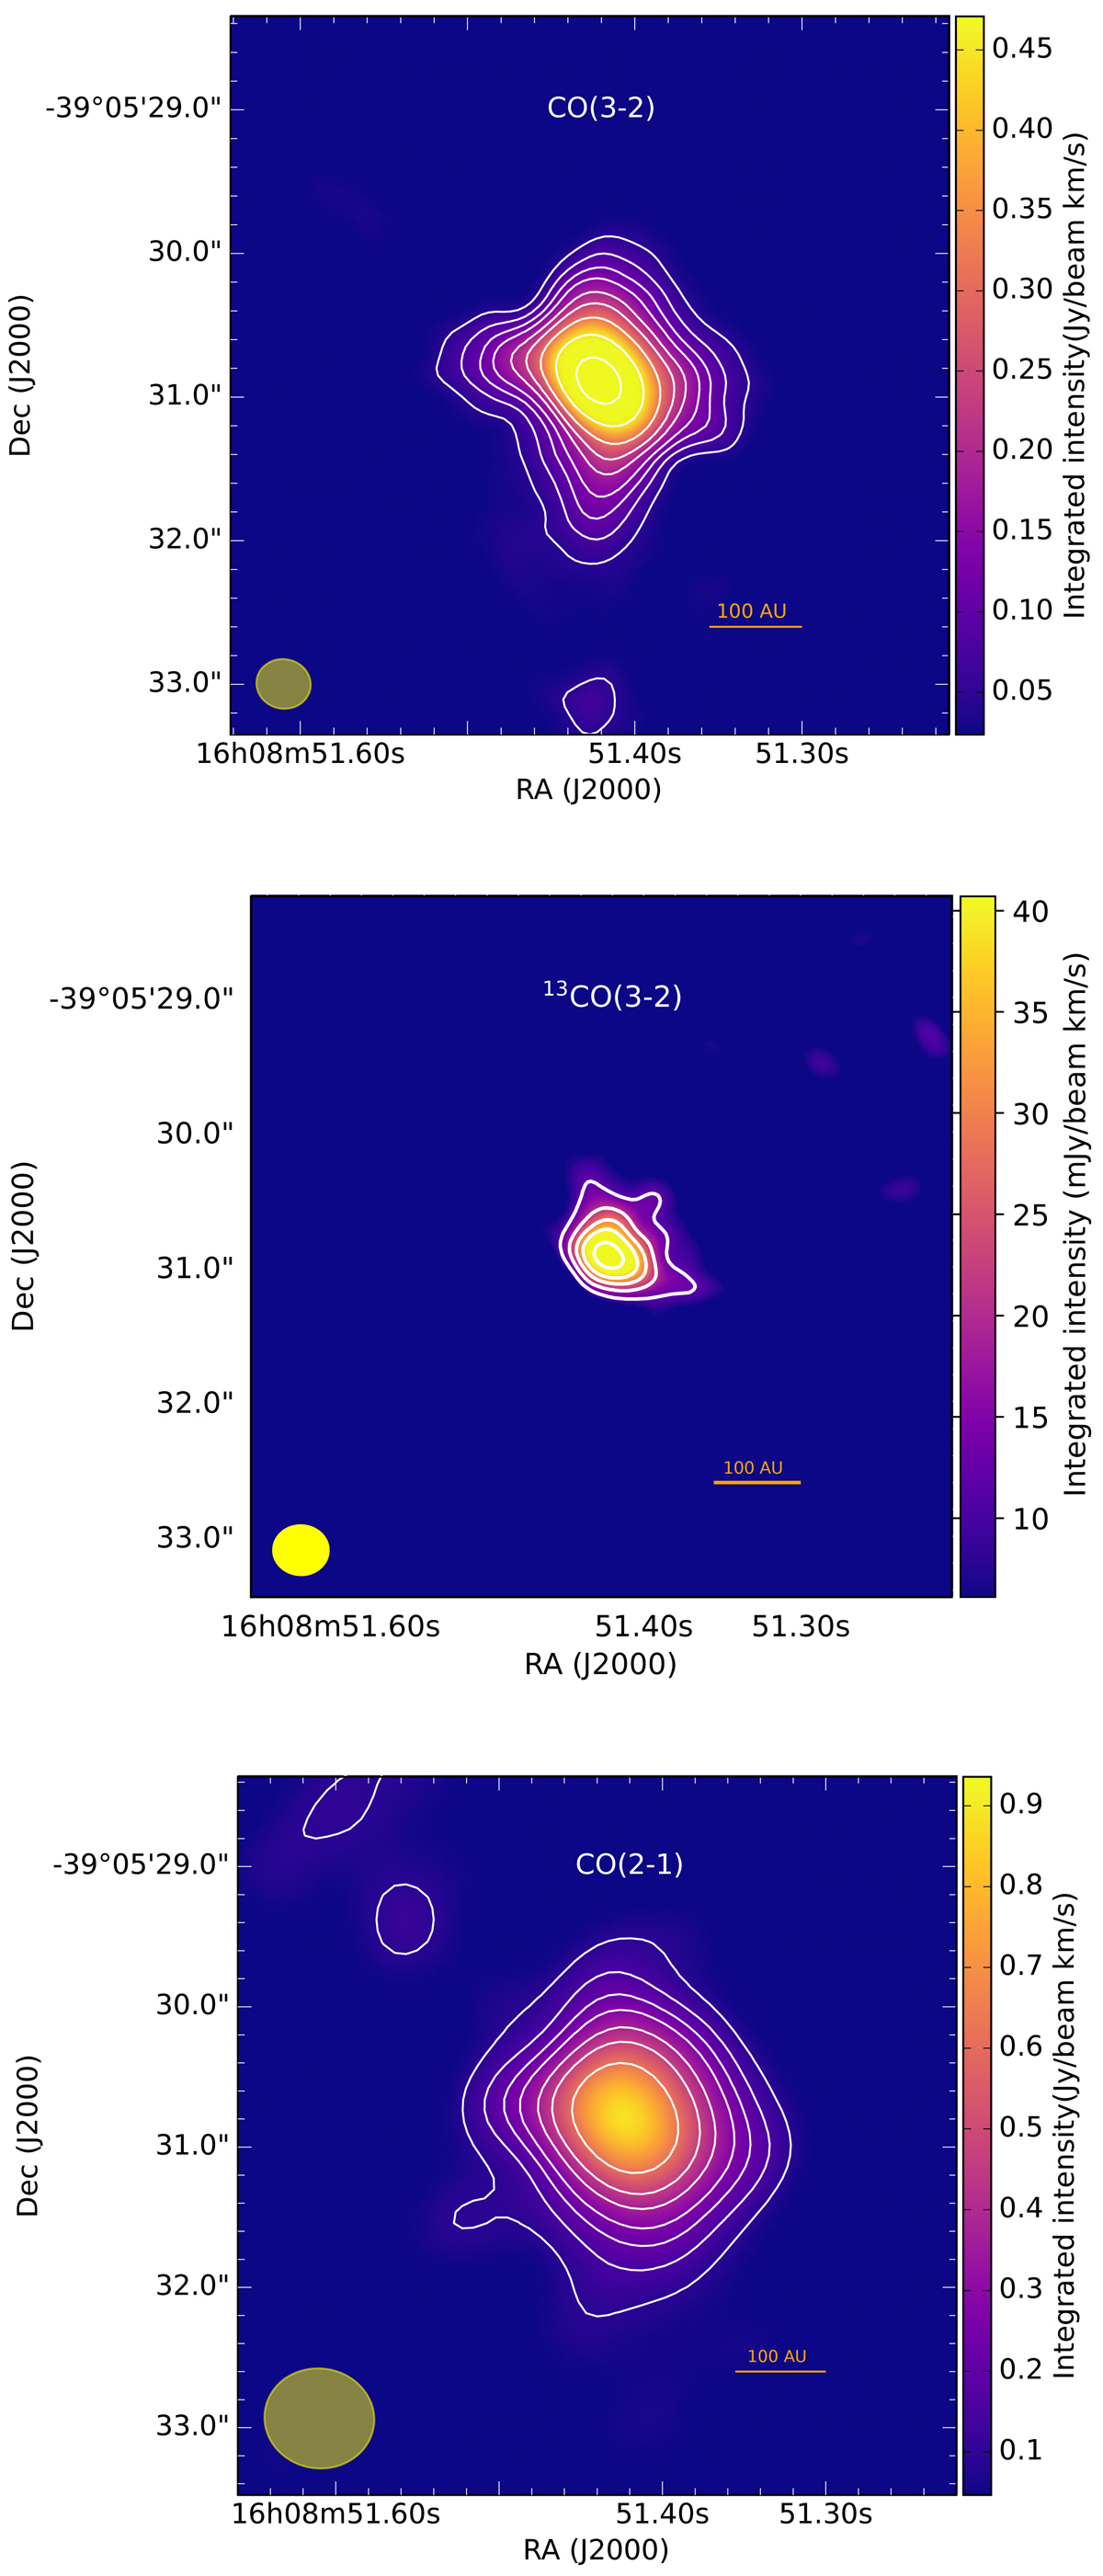
Top panel: CO(3–2) flux-integrated ALMA map from velocity −3 to 11 km s−1 with a robust value of 1. The white contours are 3, 5, 7, 9, 12, 15, 20, 30, and 50 times the rms. Middle panel: 13CO flux-integrated ALMA map from velocity −0.08 to 7.44 km s−1. The white contours are 3, 5, 7, 9, and 12 times the rms. Bottom panel: CO(2–1) flux-integrated ALMA map from velocity −2.62 to 10.08 km s−1. The white contours are 3, 5, 7, 9, 12, 15, and 20 times the rms. The beam size is represented by a yellow ellipse in the bottom left corner of the three panels. The three panels show a zoom-in of the main central core region. A zoom-out image can be found in Figs. A.2–A.4 for CO(2–1), CO(3–2), and 13CO, respectively.
Current usage metrics show cumulative count of Article Views (full-text article views including HTML views, PDF and ePub downloads, according to the available data) and Abstracts Views on Vision4Press platform.
Data correspond to usage on the plateform after 2015. The current usage metrics is available 48-96 hours after online publication and is updated daily on week days.
Initial download of the metrics may take a while.