Fig. A.2.
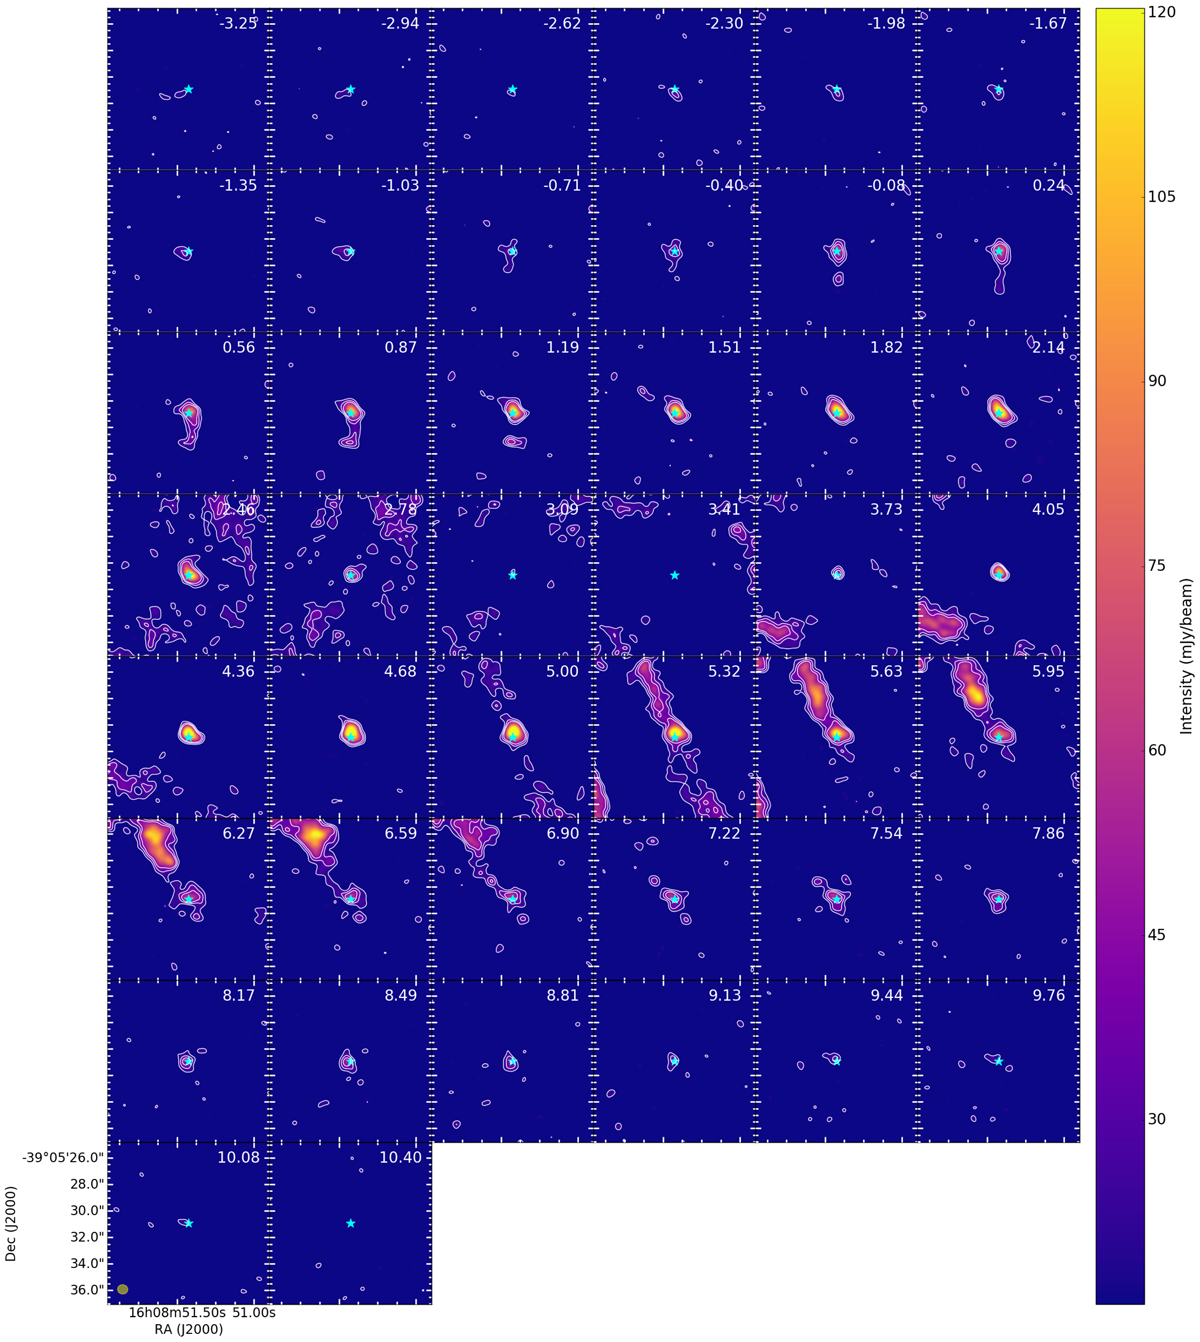
Zoom out CO(2–1) channel emission maps toward Par-Lup3-4. Contour levels are 3, 5, and 7 times the rms. The possible secondary outflow is between velocities 5.6–7.2 km s−1 from the center to the northeast of the image. The cyan star marks the position of the peak intensity of the continuum image. These maps have been obtained using a robust parameter equal to 1. The beam size is represented by a yellow ellipse in the bottom left panel. The LSR velocity in km s−1 is indicated in the top right corner of each image.
Current usage metrics show cumulative count of Article Views (full-text article views including HTML views, PDF and ePub downloads, according to the available data) and Abstracts Views on Vision4Press platform.
Data correspond to usage on the plateform after 2015. The current usage metrics is available 48-96 hours after online publication and is updated daily on week days.
Initial download of the metrics may take a while.