Fig. A.1.
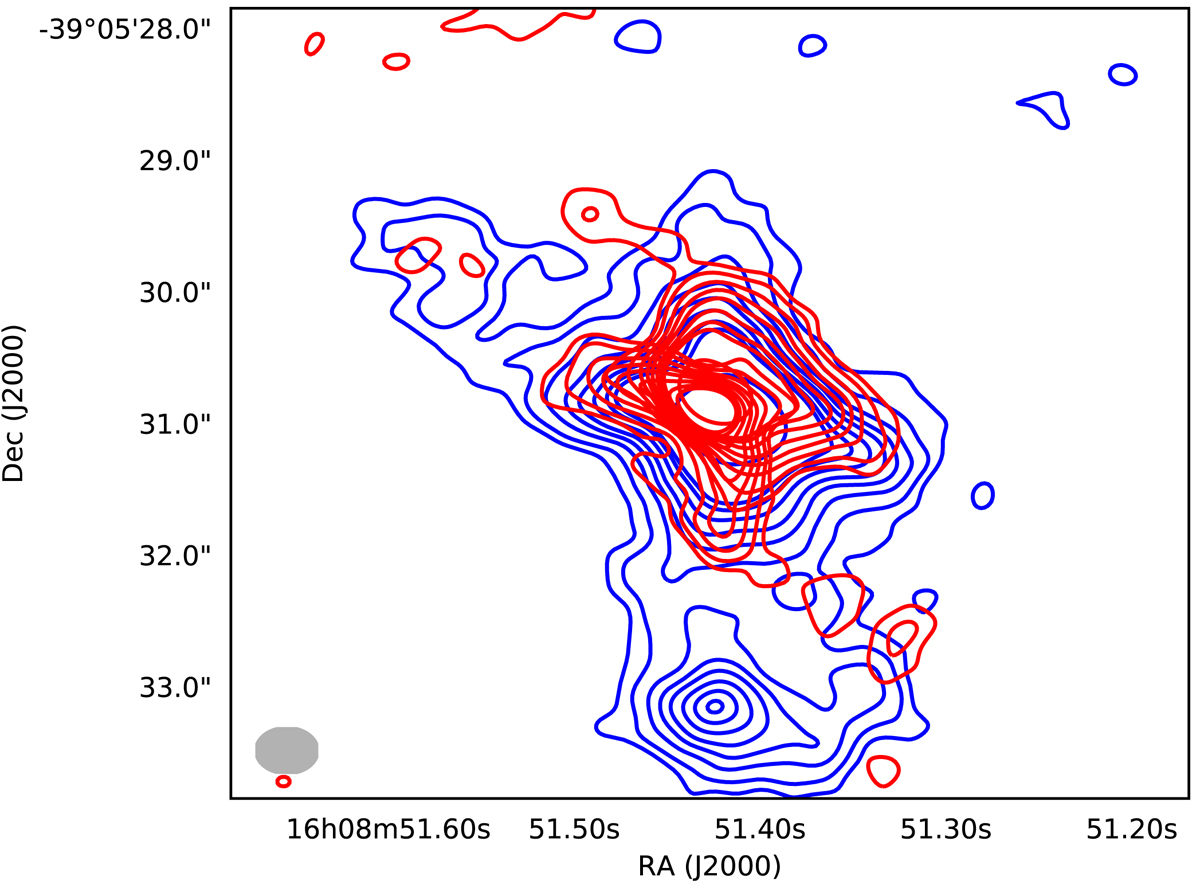
CO(3–2) integrated ALMA map. Blue contours show blueshifted emission between −1.6 km s−1 and 2.36 km s−1 and red contours show redshifted emission between [4.12 km s−1, 5.88 km s−1] and [6.76 km s−1, 9.84 km s−1]. Contour levels are 3, 5, 8, 11, 14, 18, 22, 25, and 50 times the rms. The beam size is represented by a gray ellipse in the bottom left panel.
Current usage metrics show cumulative count of Article Views (full-text article views including HTML views, PDF and ePub downloads, according to the available data) and Abstracts Views on Vision4Press platform.
Data correspond to usage on the plateform after 2015. The current usage metrics is available 48-96 hours after online publication and is updated daily on week days.
Initial download of the metrics may take a while.