Fig. 9
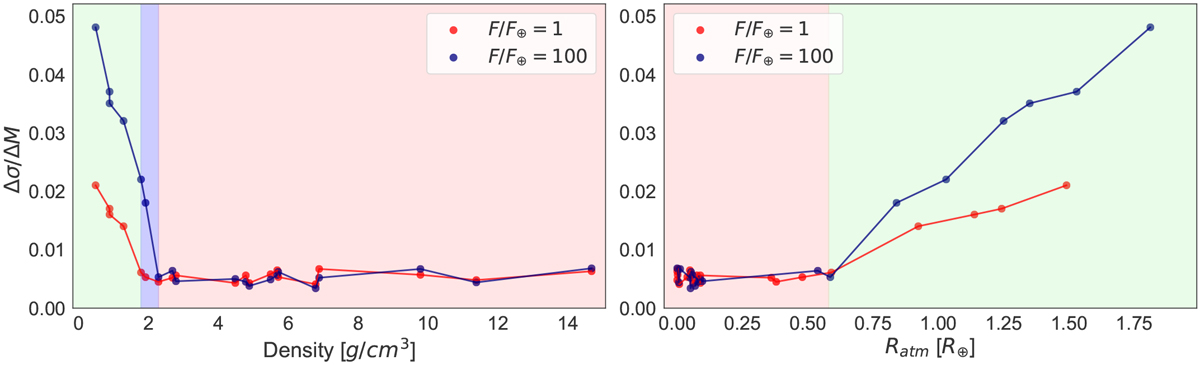
Atmospheric mass Δσ∕ΔM for the synthetic planets vs. the bulk density (left) and median atmospheric thickness (right) for different irradiation. The light green and red regions represent the ranges in which decreasing the observational uncertainties lead and do not lead to better constraints on the atmospheric mass, respectively. The blue region represents the density range in which planets with an irradiation of 100 Earth fluxes have better constrained atmospheric mass with decreasing uncertainties and planets with an irradiation of one Earth flux do not.
Current usage metrics show cumulative count of Article Views (full-text article views including HTML views, PDF and ePub downloads, according to the available data) and Abstracts Views on Vision4Press platform.
Data correspond to usage on the plateform after 2015. The current usage metrics is available 48-96 hours after online publication and is updated daily on week days.
Initial download of the metrics may take a while.