Fig. 8
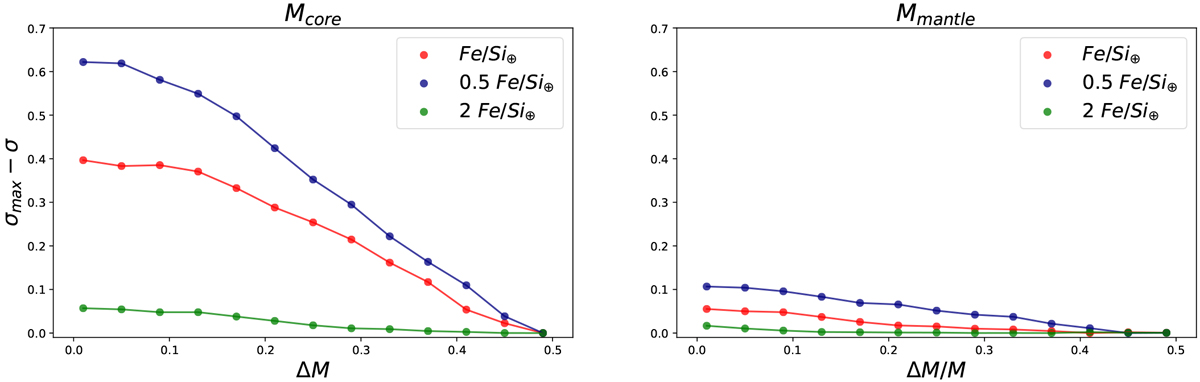
Standard deviation of the core mass (left) and mantle mass (right) for a planet of mass 15 M⊕ and radius 2.3 R⊕ vs. the width of the mass distribution. The red, green, and blue lines represent different Fe/Si in the planet. A higher value of σmax − σ indicates that the internal parameter is better constrained with respect to the reference, at which σ = σmax.
Current usage metrics show cumulative count of Article Views (full-text article views including HTML views, PDF and ePub downloads, according to the available data) and Abstracts Views on Vision4Press platform.
Data correspond to usage on the plateform after 2015. The current usage metrics is available 48-96 hours after online publication and is updated daily on week days.
Initial download of the metrics may take a while.