Fig. 2
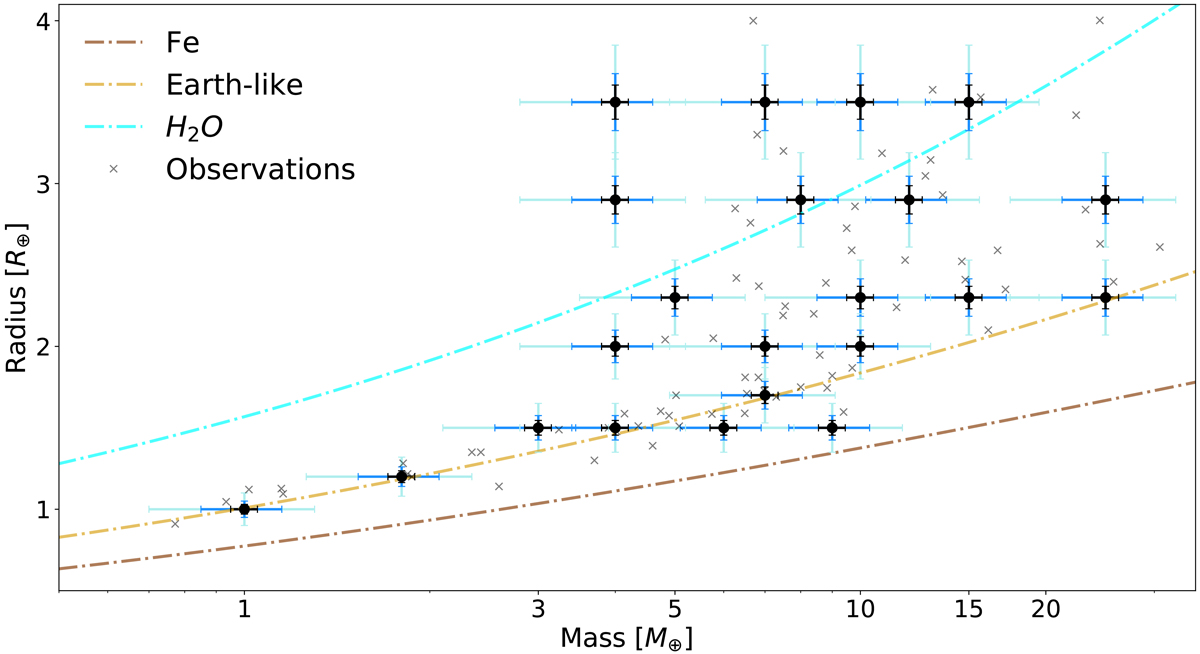
M–R diagram with the synthetic planets used in the study (black dots). The black, blue, and light blue bars correspond to uncertainties of 5, 10, and 20% in mass and 3, 5, and 10% in radius, respectively. The crosses represent observed planets from the revisited catalog in Otegi et al. (2020). The synthetic planets are plotted against the composition lines of pure-iron (brown), Earth-like (light brown), and water ice (blue).
Current usage metrics show cumulative count of Article Views (full-text article views including HTML views, PDF and ePub downloads, according to the available data) and Abstracts Views on Vision4Press platform.
Data correspond to usage on the plateform after 2015. The current usage metrics is available 48-96 hours after online publication and is updated daily on week days.
Initial download of the metrics may take a while.