Fig. 7
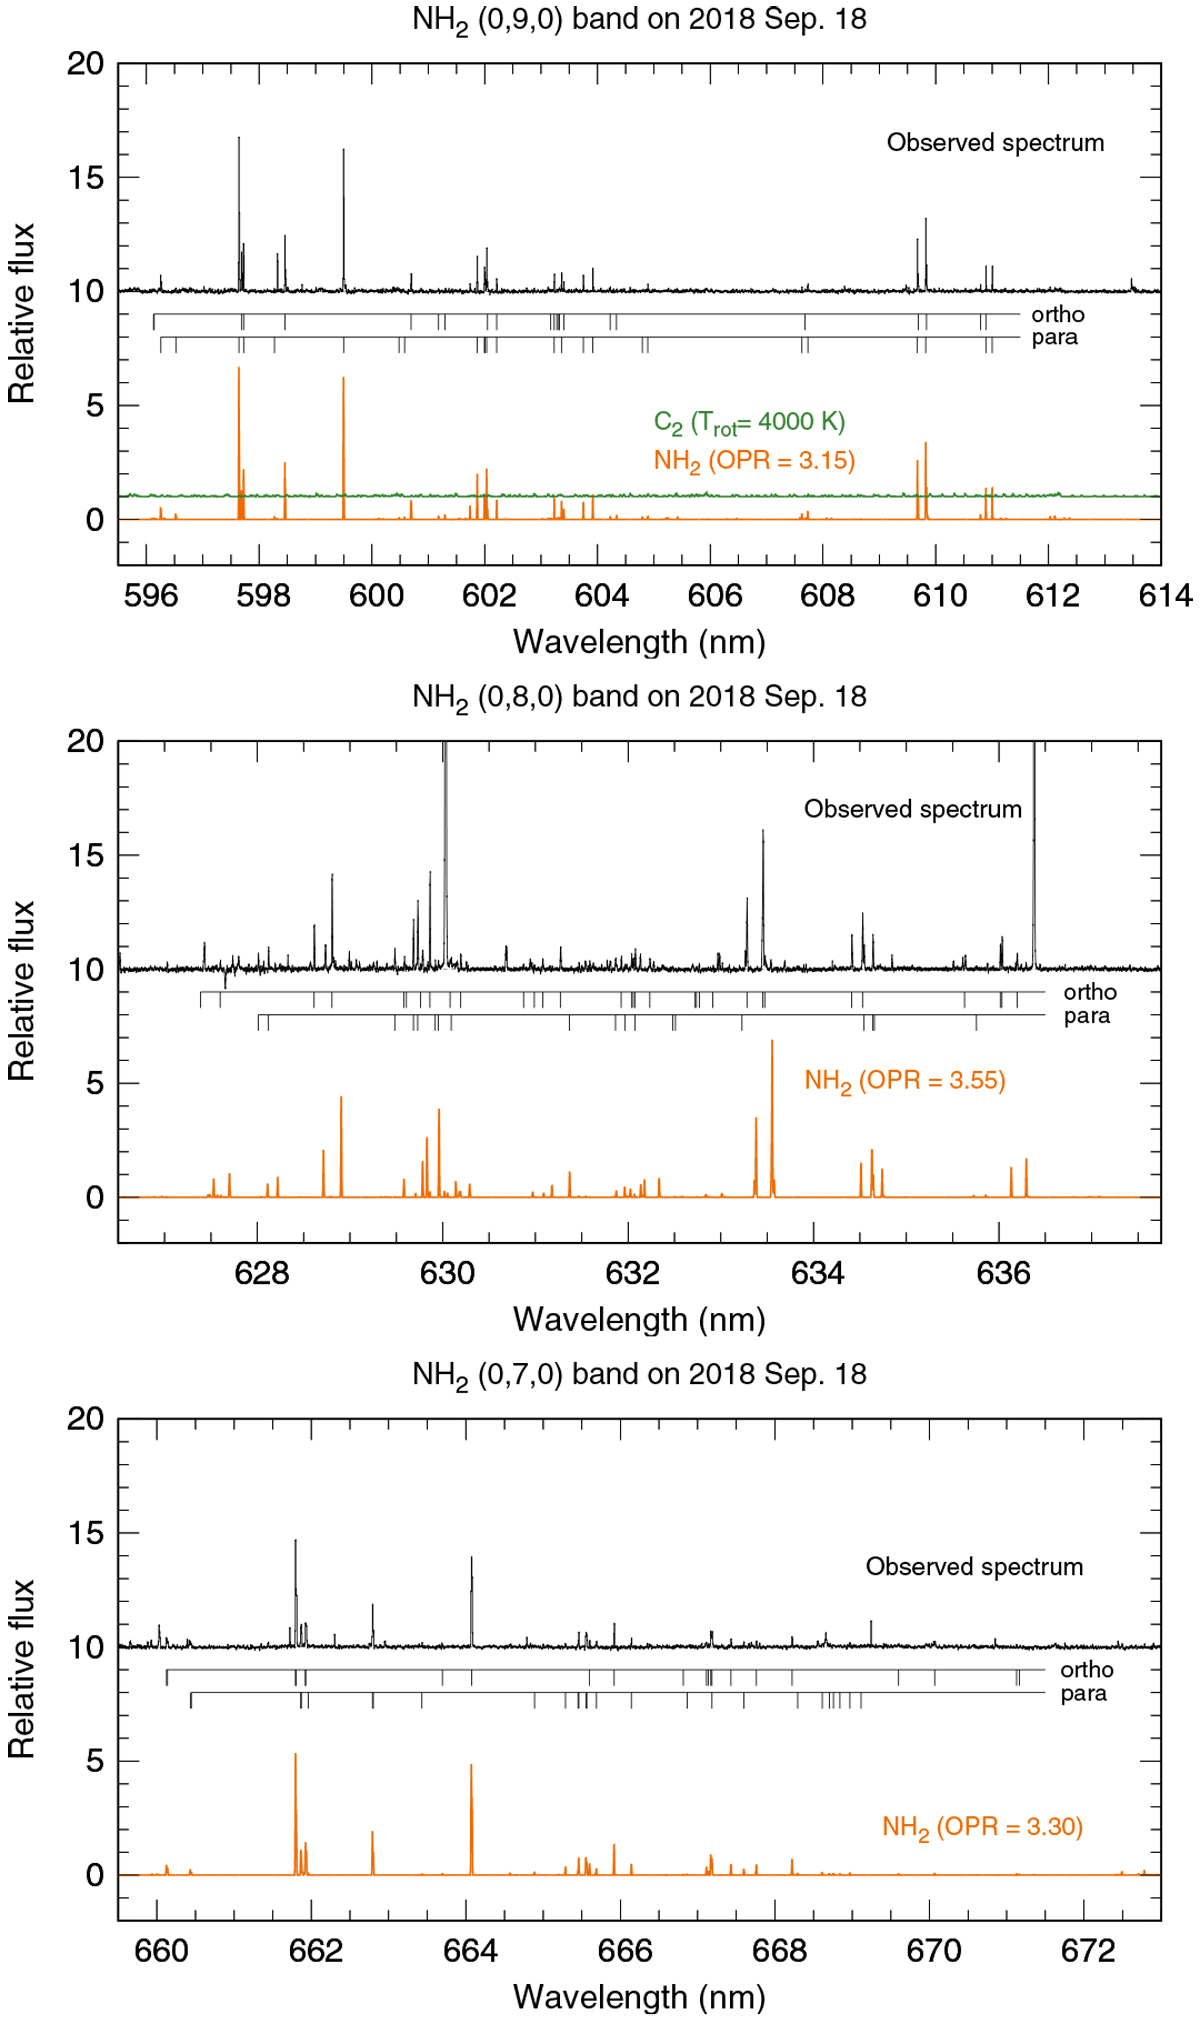
Comparison between the observed and modelled spectra of the NH2(0,9,0), (0,8,0), and (0,7,0) bands. The modelled spectrum of C2 is also plotted in the NH2 (0,9,0) band panel, but because of the depleted nature of 21P, the C2 lines do not affect the NH2 spectrum. The ortho- and para-lines of NH2 are labelled in these modelled spectra. The two strong emission lines at 6300 and 6364 Å are the forbidden oxygen lines in the NH2 (0,8,0) bandpanel. We note that the intensity ratio among bands is not correct because we scaled intensity for each plot independently.
Current usage metrics show cumulative count of Article Views (full-text article views including HTML views, PDF and ePub downloads, according to the available data) and Abstracts Views on Vision4Press platform.
Data correspond to usage on the plateform after 2015. The current usage metrics is available 48-96 hours after online publication and is updated daily on week days.
Initial download of the metrics may take a while.