Fig. 5
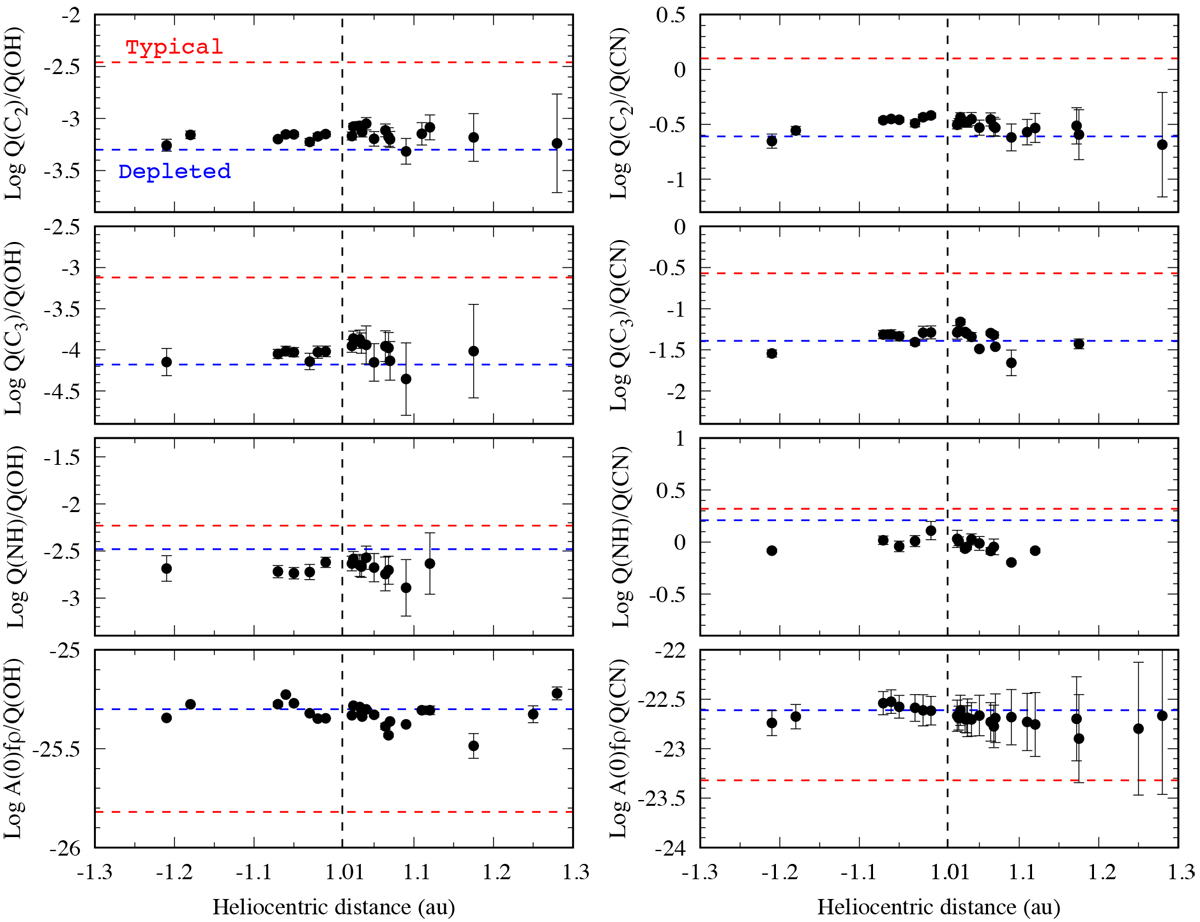
Evolution of the logarithmic production rates ratios of each species with respect to OH and to CN as a function of heliocentric distance. The dashed red line represents the mean value of typical comets as defined in A’Hearn et al. (1995), while the blue line represents the mean value of the depleted group. Bottom panels: dust-to-gas ratio represented by A(0)fρ-to-OH and A(0)fρ-to-CN. The vertical dashed line shows the perihelion distance on September 10, 2018, at rh = 1.01 au.
Current usage metrics show cumulative count of Article Views (full-text article views including HTML views, PDF and ePub downloads, according to the available data) and Abstracts Views on Vision4Press platform.
Data correspond to usage on the plateform after 2015. The current usage metrics is available 48-96 hours after online publication and is updated daily on week days.
Initial download of the metrics may take a while.