Fig. 10
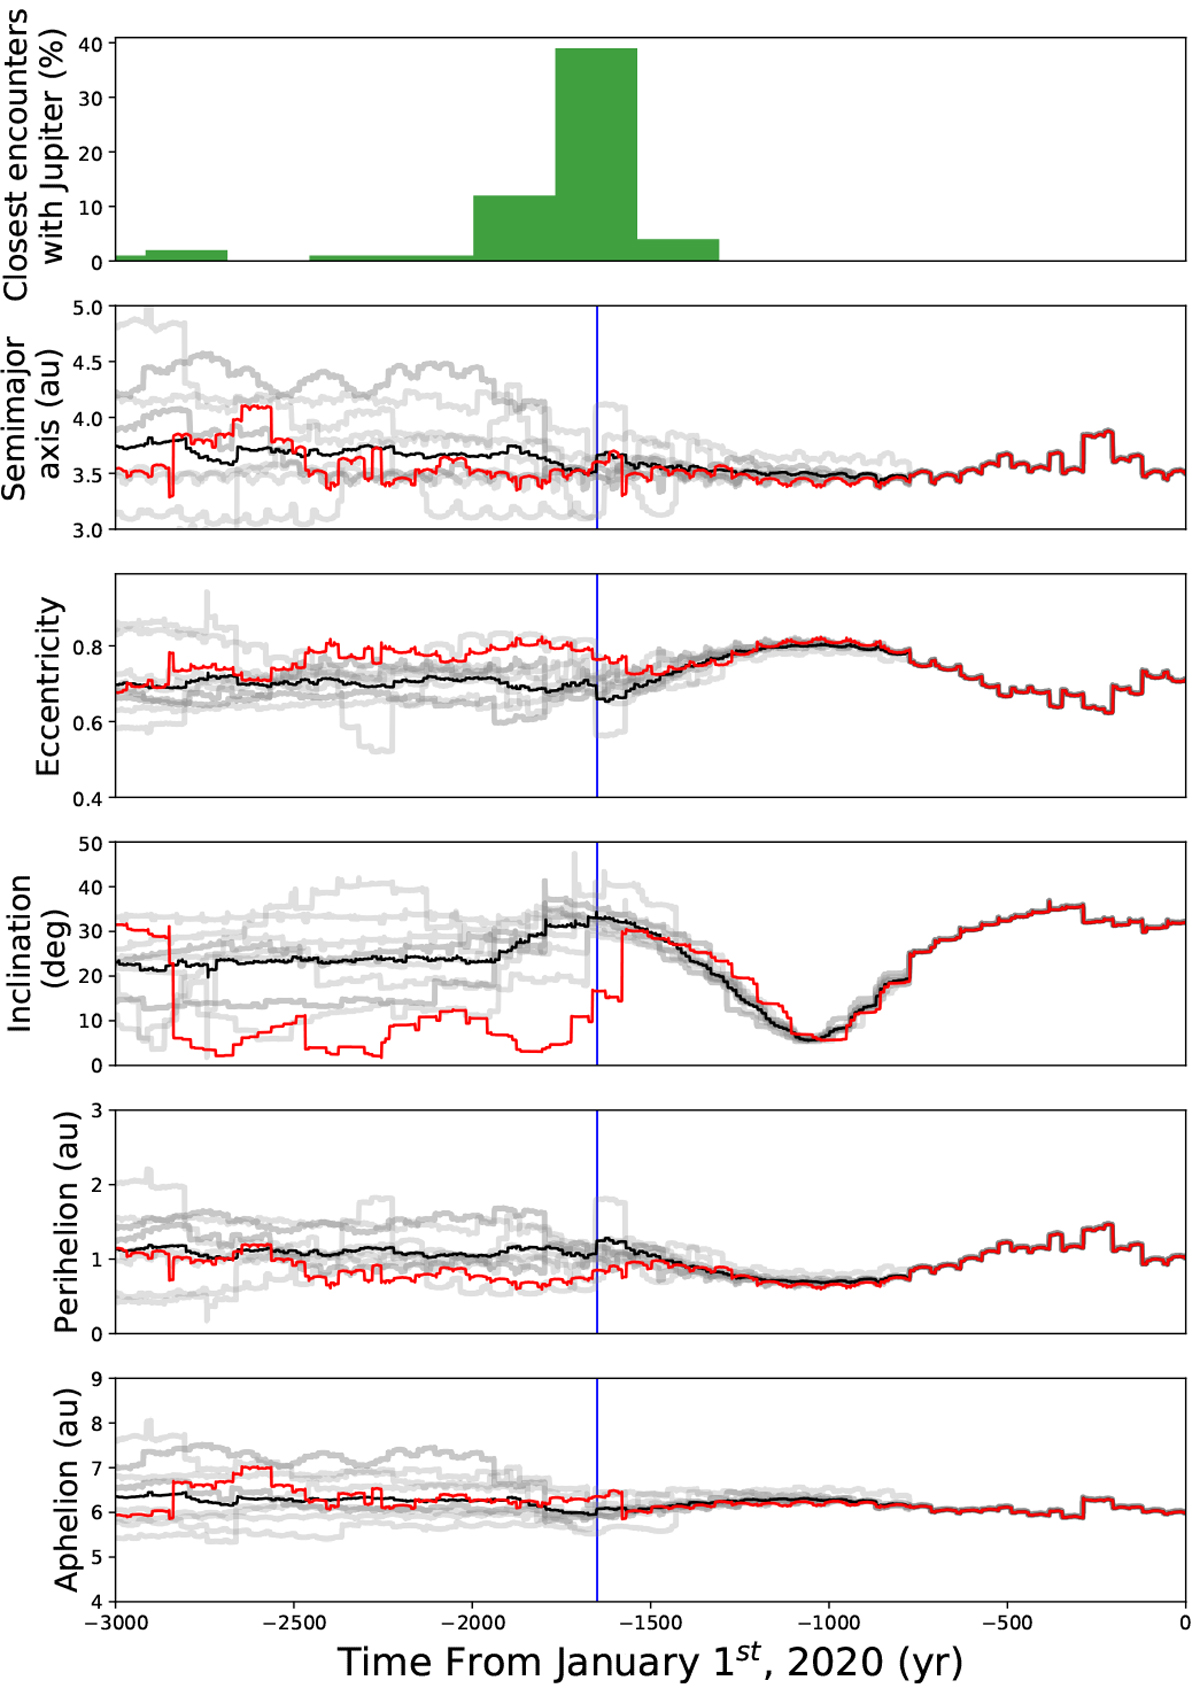
Orbital evolution of 21P and its 200 clones for 3000 yr backward in time from January 1, 2020. From top to the bottom: closest approaches with Jupiter, semi-major axis, eccentricity, inclination, perihelion, and aphelion distance. In all panels, the grey lines correspond to the evolution of each clone, the black line is the mean value of the clones, and the red line is that of the nominal comet 21P. The vertical blue line corresponds to the time of the closest encounter with Jupiter. Theinitial orbital elements were taken from the JPL Small-Body Data Browser (orbital solution JPL K182/3).
Current usage metrics show cumulative count of Article Views (full-text article views including HTML views, PDF and ePub downloads, according to the available data) and Abstracts Views on Vision4Press platform.
Data correspond to usage on the plateform after 2015. The current usage metrics is available 48-96 hours after online publication and is updated daily on week days.
Initial download of the metrics may take a while.