Fig. 1
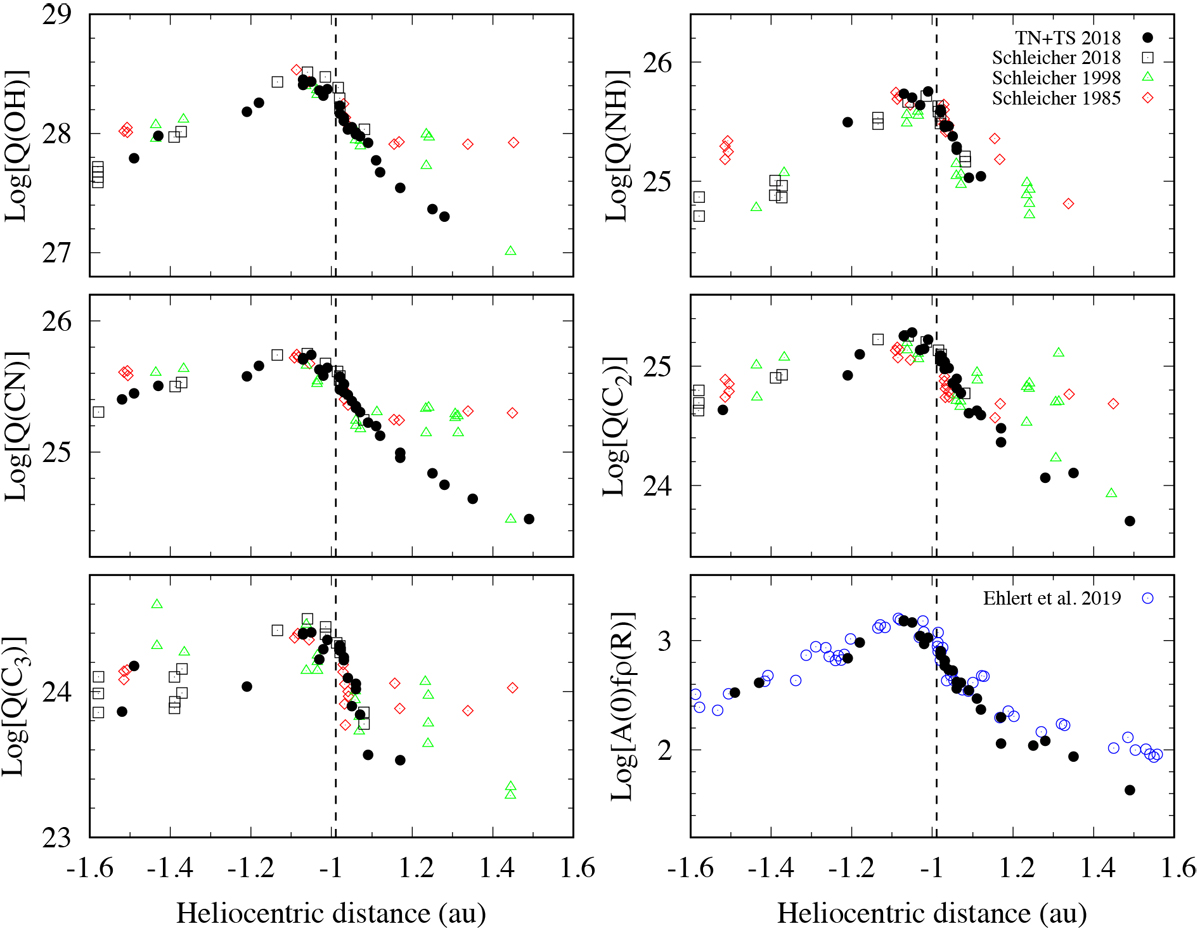
Logarithm of the production rates (in mol s−1) of each observed species and of the A(0)fρ parameter (in cm) of comet 21P during its 2018 return (this work and Schleicher & Knight 2018) compared with two previous apparitions in 1985 and 1998 (Schleicher & Knight 2018) as a function of heliocentric distance. The dashed vertical line represents the perihelion distance on September 10, 2018. The maximum of the gas and dust activity was reached at 1.07 au from the Sun on August 17, 2018, 24 days before perihelion.
Current usage metrics show cumulative count of Article Views (full-text article views including HTML views, PDF and ePub downloads, according to the available data) and Abstracts Views on Vision4Press platform.
Data correspond to usage on the plateform after 2015. The current usage metrics is available 48-96 hours after online publication and is updated daily on week days.
Initial download of the metrics may take a while.