Fig. 2
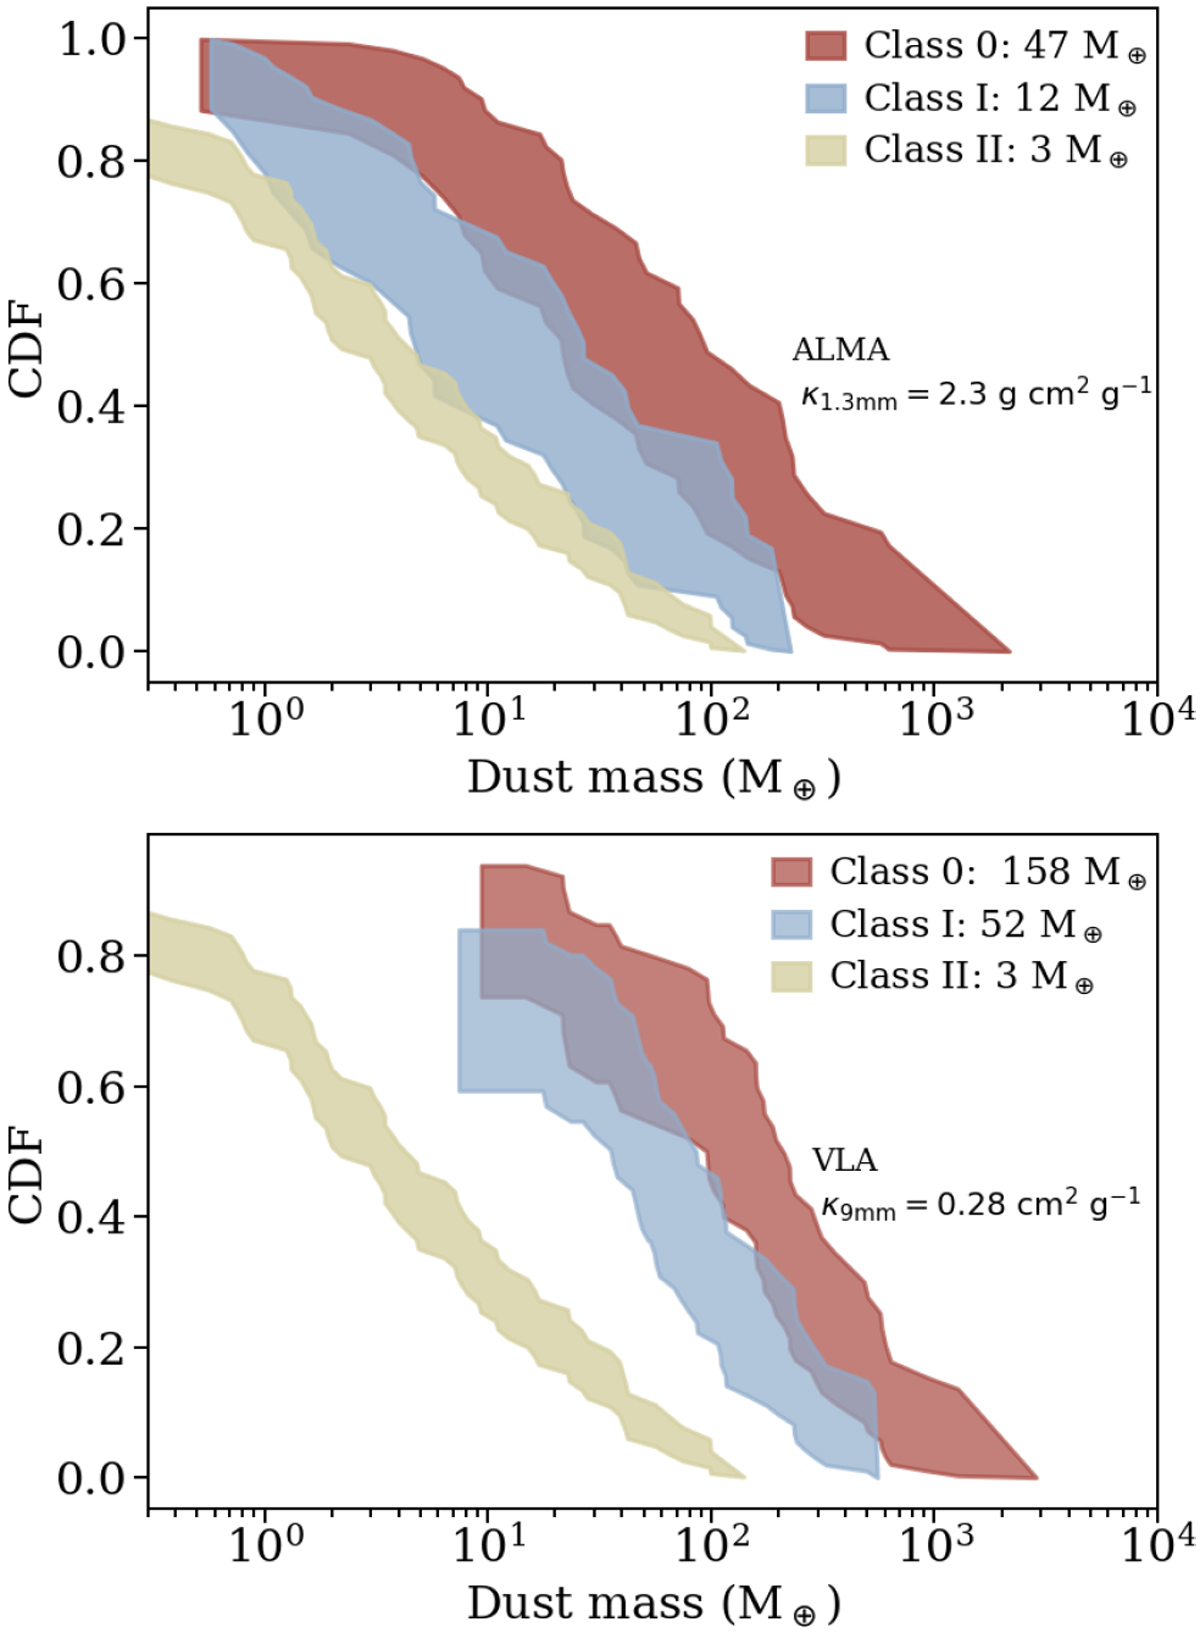
Cumulative distribution plots of the dust disk masses. Top: masses of the Perseus Class 0 and I disks measured with ALMA at 1 mm compared with the Lupus Class II disks measured with ALMA (Ansdell et al. 2016). The opacity value of κ1.3 mm = 2.3 cm2 g−1 is used to calculate the masses. The ALMA sample consist of 77 sources (38 Class 0 and 39 Class I) and the Lupus sample consist of 69 sources. Bottom: masses of the Perseus Class 0 and I disks measured with VLA at 9 mm (red and blue, respectively), compared with the Lupus Class II disks measured with ALMA (Ansdell et al. 2016). The opacity value of κ9 mm =0.28 cm2 g−1 is used to calculate the VLA masses. The VLA sample consist of 100 sources (49 Class 0 and 51 Class I). Medians are indicated in the labels.
Current usage metrics show cumulative count of Article Views (full-text article views including HTML views, PDF and ePub downloads, according to the available data) and Abstracts Views on Vision4Press platform.
Data correspond to usage on the plateform after 2015. The current usage metrics is available 48-96 hours after online publication and is updated daily on week days.
Initial download of the metrics may take a while.