| Issue |
A&A
Volume 640, August 2020
|
|
|---|---|---|
| Article Number | C5 | |
| Number of page(s) | 1 | |
| Section | Galactic structure, stellar clusters and populations | |
| DOI | https://doi.org/10.1051/0004-6361/202037819e | |
| Published online | 26 August 2020 | |
Full 5D characterisation of the Sagittarius stream with Gaia DR2 RR Lyrae (Corrigendum)
1
Dept. FQA, Institut de Ciències del Cosmos (ICCUB), Universitat de Barcelona (IEEC-UB), Martí Franquès 1, 08028 Barcelona, Spain
e-mail: pramos@fqa.ub.edu
2
Departamento de Astronomía, Instituto de Física, Universidad de la República, Iguá 4225, CP 11400 Montevideo, Uruguay
3
Kapteyn Astronomical Institute, University of Groningen, Landleven 12, 9747 AD Groningen, The Netherlands
Key words: Galaxy: halo / stars: variables: RR Lyrae / galaxies: dwarf / astrometry / errata, addenda
A mistake has been identified in the text describing the process involved in obtaining Eq. (A.1). The Gaia passbands that were used to calculate the observed colours (GBP − GRP) in the simulations are the ones by Evans et al. (2018), instead of Maíz Apellániz & Weiler (2018), as was originally reported. Consequently, Fig. A.1 has been corrected to include the points with the Evans et al. (2018) passbands.
This modification only affects the text in Appendix A and does not affect the coefficients of Eq. (A.1). Therefore, it does not affect our analysis or any other part of the manuscript either.
References
- Evans, D. W., Riello, M., De Angeli, F., et al. 2018, A&A, 616, A4 [NASA ADS] [CrossRef] [EDP Sciences] [Google Scholar]
- Maíz Apellániz, J., & Weiler, M. 2018, A&A, 619, A180 [NASA ADS] [CrossRef] [EDP Sciences] [Google Scholar]
- Westera, P., Lejeune, T., Buser, R., Cuisinier, F., & Bruzual, G. 2002, A&A, 381, 524 [NASA ADS] [CrossRef] [EDP Sciences] [Google Scholar]
Appendix A: Reddening to absorption transformations
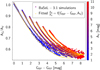 |
Fig. A.1. Fitted relationship between |

© ESO 2020
All Figures
|
Fig. A.1. Fitted relationship between |
| In the text | |
Current usage metrics show cumulative count of Article Views (full-text article views including HTML views, PDF and ePub downloads, according to the available data) and Abstracts Views on Vision4Press platform.
Data correspond to usage on the plateform after 2015. The current usage metrics is available 48-96 hours after online publication and is updated daily on week days.
Initial download of the metrics may take a while.